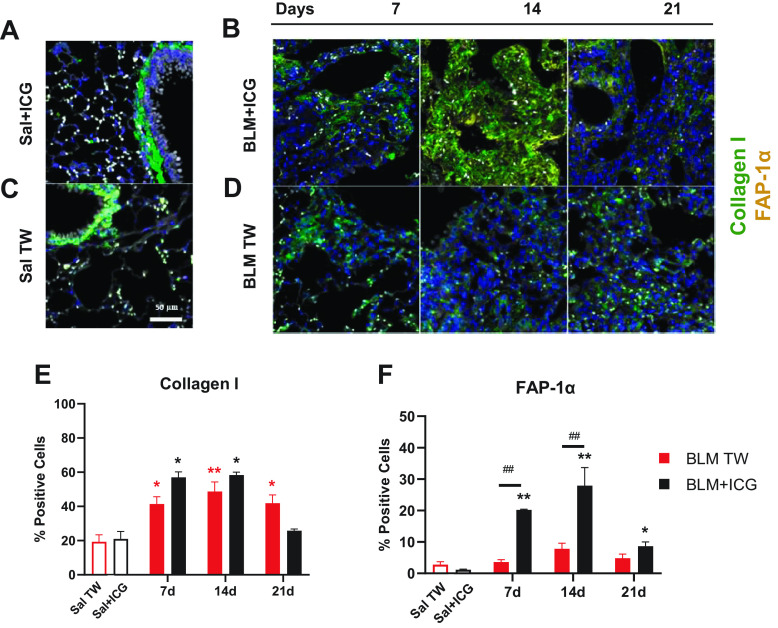
Figure 4.
Immunofluorescence staining of Collagen I and FAP-1α. Representative immunofluorescence microphotographs of lung parenchyma (×20 magnification; scale bar 50 µm) from mice treated with Sal+ICG (A) and BLM+ICG (B) at the indicated post-OA time points. C and D: same as A and B for the Sal and BLM-only groups. Parenchymal cells were immunolabeled for Collagen I and FAP-1α; nuclei were visualized with DAPI (blue), Collagen I was stained with Alexa Fluor 647 (green) and FAP-1α with Alexa Fluor 488 (red). E: immunofluorescence data quantitation and time-dependent variation of the number of Collagen I-positive cells in mice treated with BLM+ICG or BLM, using Sal+ICG- and Sal-treated animals as controls. F: same as E for FAP-1α quantitation. Asterisks indicate statistical significance vs. the corresponding control groups (*P < 0.05; **P < 0.01). Hashtags indicate the significance of intergroup (BLM+ICG vs. BLM-only) differences (##P < 0.01). BLM, bleomycin; ICG, indocyanine green; OA, oropharyngeal aspiration; Sal, saline.

