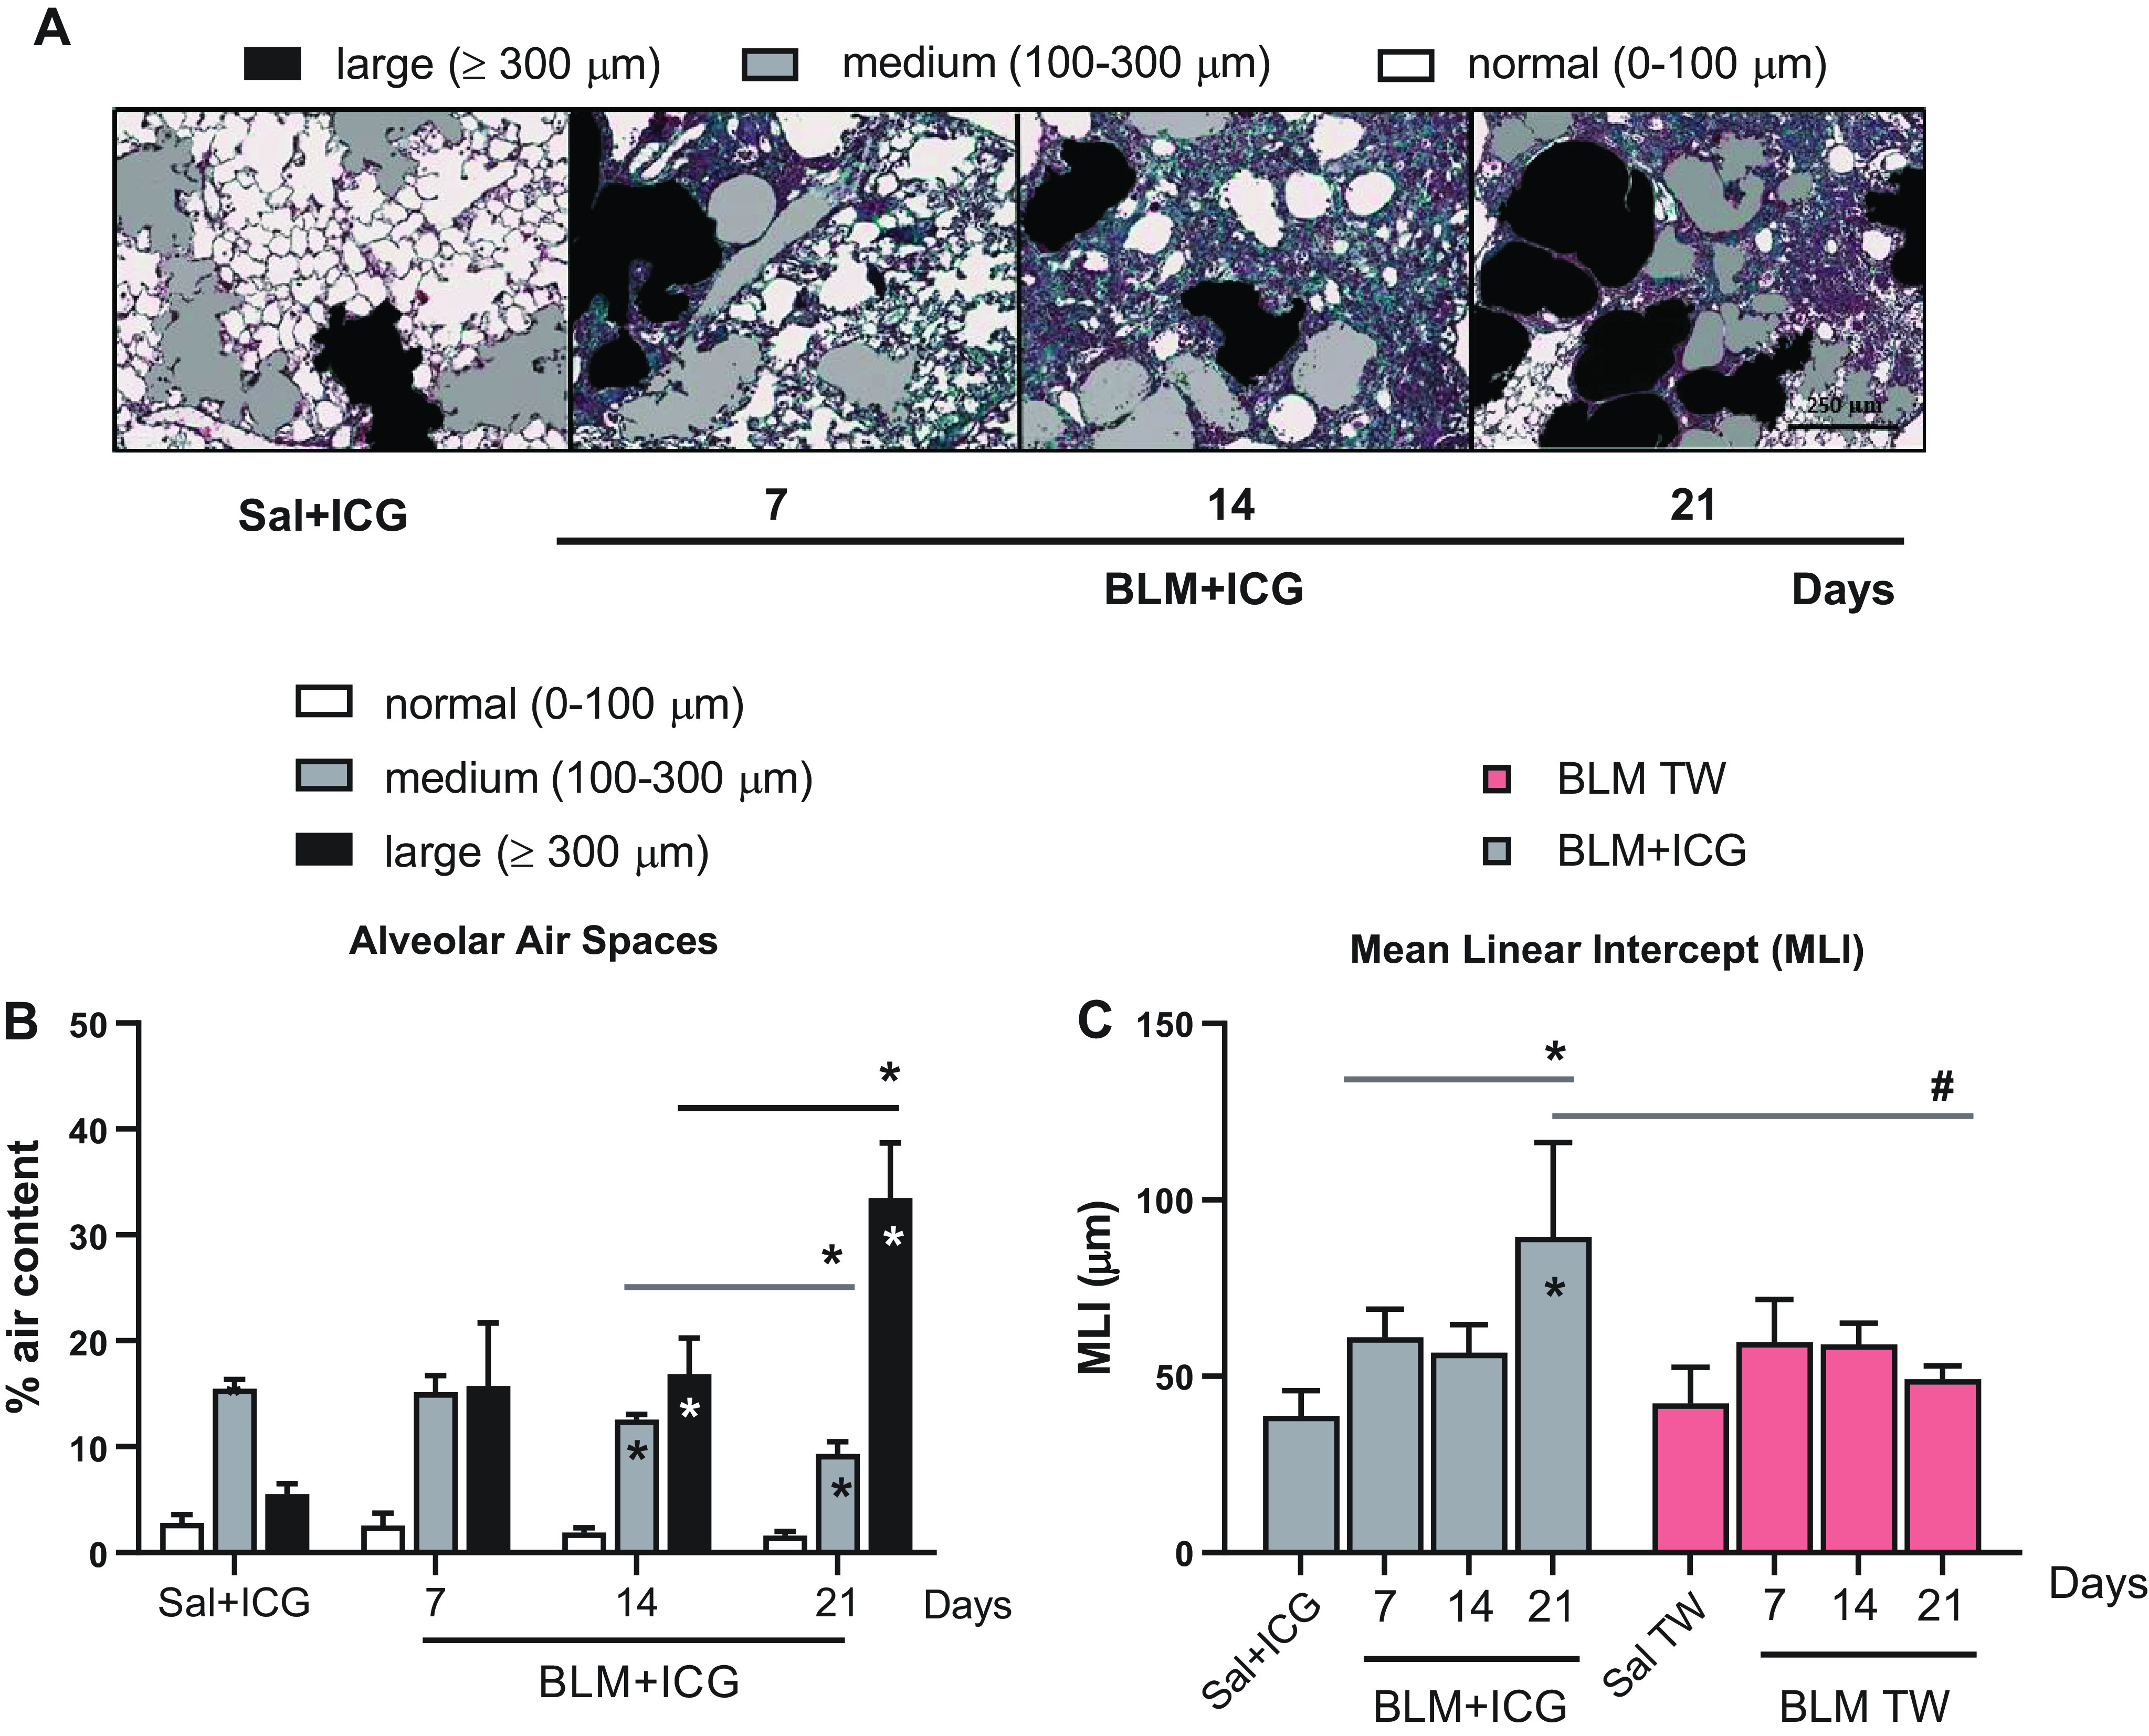
Figure 5.

Histomorphometric evaluation of air space enlargement. A: representative images of differently sized alveolar air spaces in lung tissue samples from control (Sal+ICG) and BLM+ICG- mice at different times after treatment as indicated (×10 magnification; scale bar 250 µm). Alveolar air space size and mean linear intercept (MLI) for the Sal+ICG and Sal control groups remained essentially constant throughout all time points. Images, shown with original histological colors (Masson’s Trichrome stain), were analyzed with Visiopharm. The air space size categories used for classification are shown at the top. B: distribution of the different air space size categories (% air content) in the control (Sal+ICG) and BLM+ICG groups described in A. Asterisks within the bars indicate the significance of BLM+ICG vs. Sal+ICG differences; asterisks shown above the bars (horizontal lines) indicate the statistical significance of the differences between the various time points (*P < 0.05). C: alveolar air spaces evaluation by mean linear intercept (MLI) analysis of the BLM+ICG and the BLM-only groups at different time points, as indicated. MLI values are compared with the appropriate controls (Sal+ICG and Sal, respectively) within each group and between the two groups (BLM+ICG and BLM-only); asterisks within the bars indicate the significance of the differences with respect to the controls (Sal+ICG or Sal); asterisks shown above the bars (horizontal lines) indicate the statistical significance of the differences between the various time points (*P < 0.05); hashtags indicate the significance of intergroup (BLM+ICG vs. BLM-only) differences (#P < 0.05). BLM, bleomycin; ICG, indocyanine green; Sal, saline.
