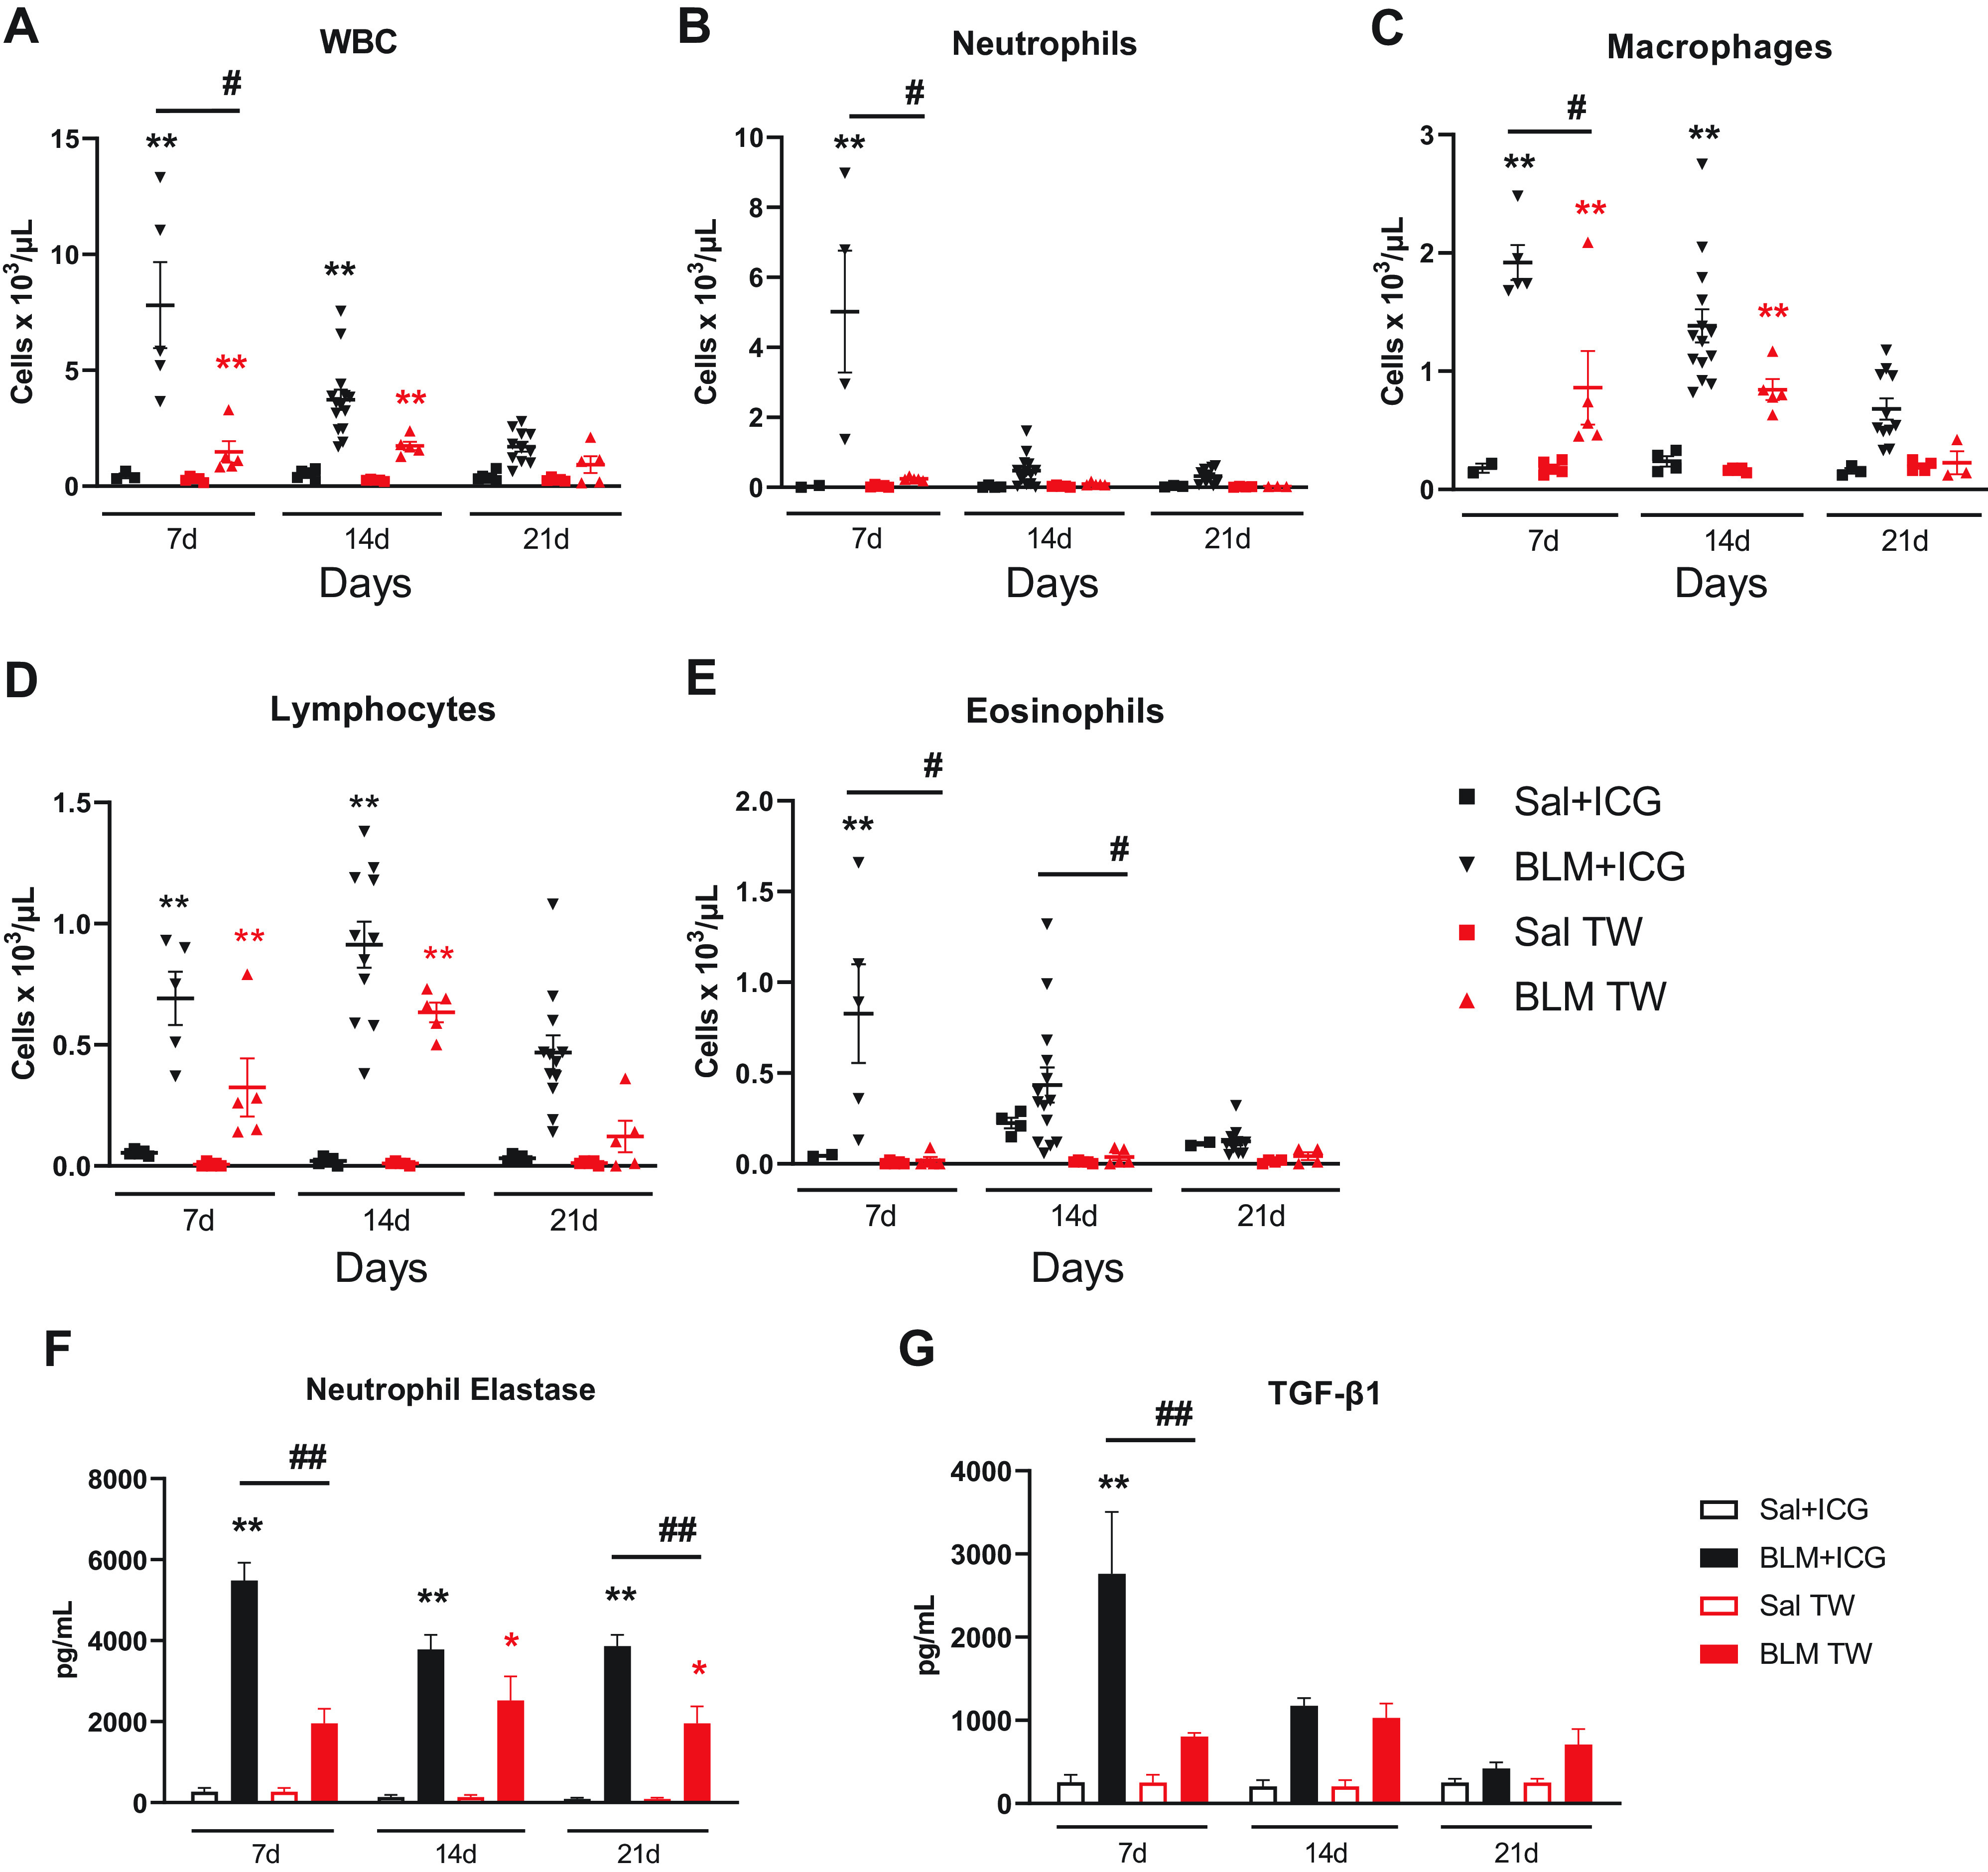
Figure 6.

Inflammatory cells profiling, neutrophil elastase, and TGF-β1 levels in the BAL fluid. Leukocyte infiltration of the BALF from differently treated (Sal+ICG, BLM+ICG, Sal, and BLM) groups. Time-dependent variation in the abundance of total white blood cells (WBC; A), neutrophils (B), macrophages (C), lymphocytes (D), and eosinophils (E). Data are the means ± SE of three independent experiments. Two-way ANOVA with Sidak’s correction for multiple comparisons was applied to the following number of animals (n): Sal, Sal+ICG, and BLM groups, n = 5 for each time point; BLM+ICG groups, n = 12 for each time point; *P < 0.05, **P < 0.01, BLM+ICG vs. Sal+ICG; #P < 0.05 BLM+ICG vs. BLM-only group. F: neutrophil elastase levels measured in the BAL of Sal+ICG, BLM+ICG, Sal, and BLM mice at days 7, 14, and 21. G: TGF-β1 measured in the BAL of Sal+ICG, BLM+ICG, Sal, and BLM mice at days 7, 14, and 21. Data, expressed as pg/ml, are the means ± SE of three independent replicates. Two-way ANOVA with Tukey’s test for multiple comparisons was used to compare treatment/control pairs (BLM+ICG vs. Sal+ICG group and BLM vs. Sal) at each of the indicated time points. Statistical analysis was applied to the following number of animals (n): Sal, Sal+ICG, and BLM groups, n = 5 for each time point; BLM+ICG groups, n = 12 for each time point. **in black P < 0.01 BLM+ICG vs. Sal+ICG; *in red P < 0.05 BLM vs. Sal; ##P < 0.01 BLM+ICG vs. BLM group. BAL, bronchoalveolar lavage; BLM, bleomycin; ICG, indocyanine green; Sal, saline.
