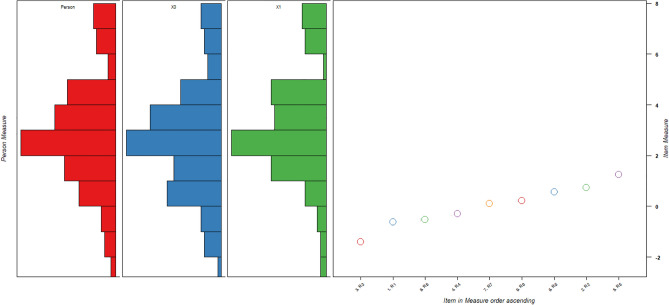
Figure 1.
Person-item Wright Map of RI-9. Legend: Histogram representing person distribution, more able persons with high level of resilience are located at the top of the map. More difficult (strong resilience) items are located at the top of the map, X1 = Male group, X2 = Female group, Circles are item threshold, item 3 is the easiest item; item 5 is the hardest. The mean of the items is much lower than the person’s ability, indicating that RI-9 is relatively easy for this sample.

