
FIGURE 4.
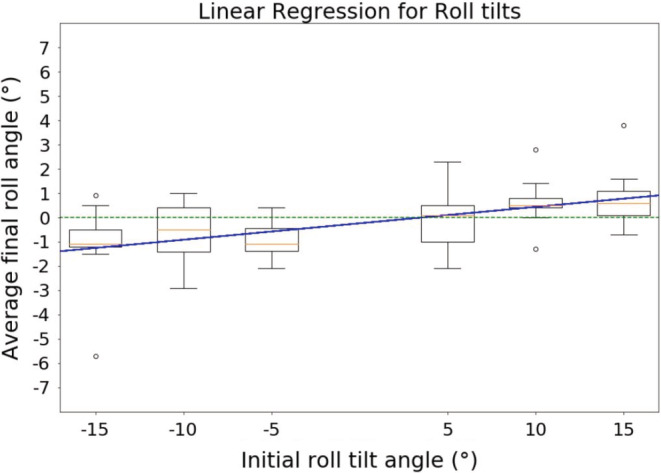
Trend of accuracy average for roll tilts. Negative tilts are left roll tilts; positive tilts are right roll tilts. This figure shows the trend of the accuracy average with respect to the initial tilt angle (averaged across every pilot) for roll tilts only. Even though the slope of the linear regression is small (0.068), we can see a clear tendency to bias with respect to the initial tilt: The greater the initial tilt angle, the less precise the pilots were, although maintaining the direction of the initial tilt. Furthermore, a Friedman test showed this bias is statistically significant (p < 0.01).