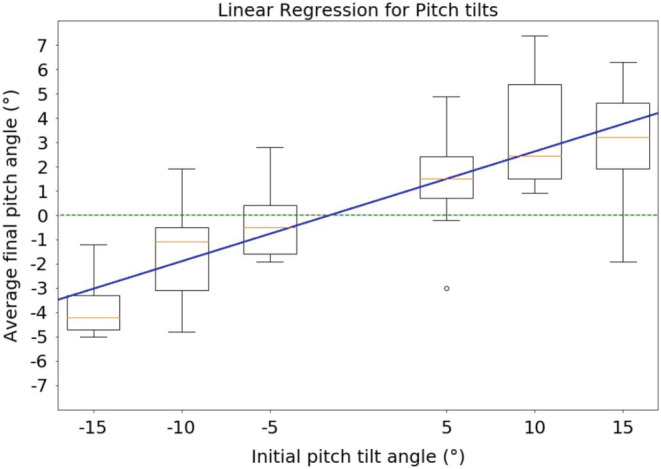
FIGURE 5.

Trend of accuracy for pitch tilts. Negative tilts are backward pitch tilts; positive tilts are forward pitch tilts.This figure shows the same thing as Figure 4 but for pitch tilts. The result is the same but more prominent, here the slope of the linear regression is 0.22. A Friedman test also showed a statistically significant bias toward the initial tilt angle (p < 0.0001).
