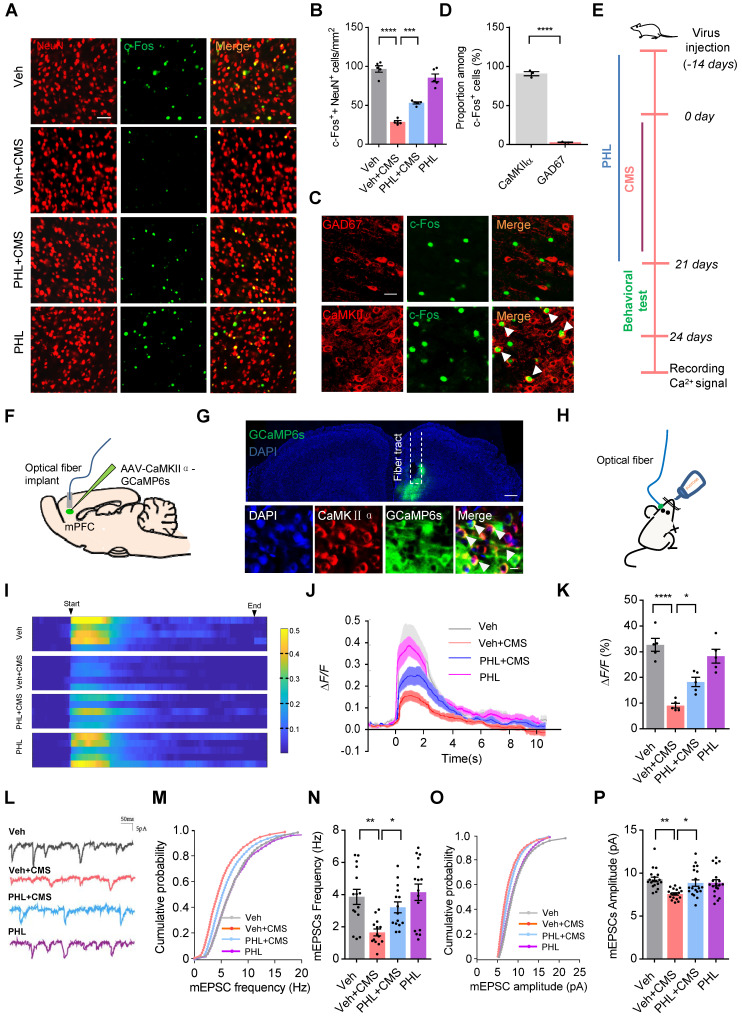
Figure 3.
PHL improves the neuronal activity in mPFC after CMS exposure. (A) Representative immunostaining images of NeuN (red) and c-Fos (green) in the mPFC. Scale bar = 50 μm. (B) Quantification of c-Fos and NeuN double-positive cells in the mPFC (n = 5 rats per group). (C) Representative images of CaMKIIα or GAD67 positive cells co-labeled with c-Fos positive cells in the mPFC of Veh group rats after FST. White arrowheads showed the co-labeled cells. Scale bar = 20 μm. (D) Quantification of CaMKIIα or GAD67 and c-Fos double-positive cells in the mPFC of Veh group rats after FST (n = 3 rats per group). (E) Timeline of the experimental procedure for recording Ca2+ signals. (F) Schematic illustration of fiber photometry recording paradigm in vivo. (G) Representative images of the expression of GCaMP6s in excitatory neurons and the position of optical fiber tract in the mPFC (top). Scale bar = 200 μm. Bottom: representative images of the co-localization of GCaMP6s-expressing cells (green) and CaMKIIα positive cell (red) in the mPFC. White arrowheads showed the co-labeled cells. Scale bar = 20 μm. (H) Schematic of fiber photometry recording in the sucrose water intake-induced changes of Ca2+ signals. (I) Representative heat maps showed the changes of Ca2+ signals evoked by sucrose water in different groups. (J-K) Representative traces (J) and average ΔF/F (K) of GCaMP6s signals during in sucrose water intake (n = 5 rats per group). (L) Representative mEPSCs (mini excitatory postsynaptic current) traces from pyramidal neurons in the mPFC of different group rats. (M-P) Cumulative distribution (M, O) and average frequency (N) and amplitude (P) of mEPSCs in the mPFC of different group rats (n = 14 to 19 cells from 5 rats per group). Data are shown as mean ± SEM. One-way ANOVA with the Tukey's post hoc test (B, K, N, P). Two-tailed t tests (D). ∗p < 0.05, ∗∗p < 0.01, ∗∗∗p < 0.001, ∗∗∗∗p < 0.0001.

