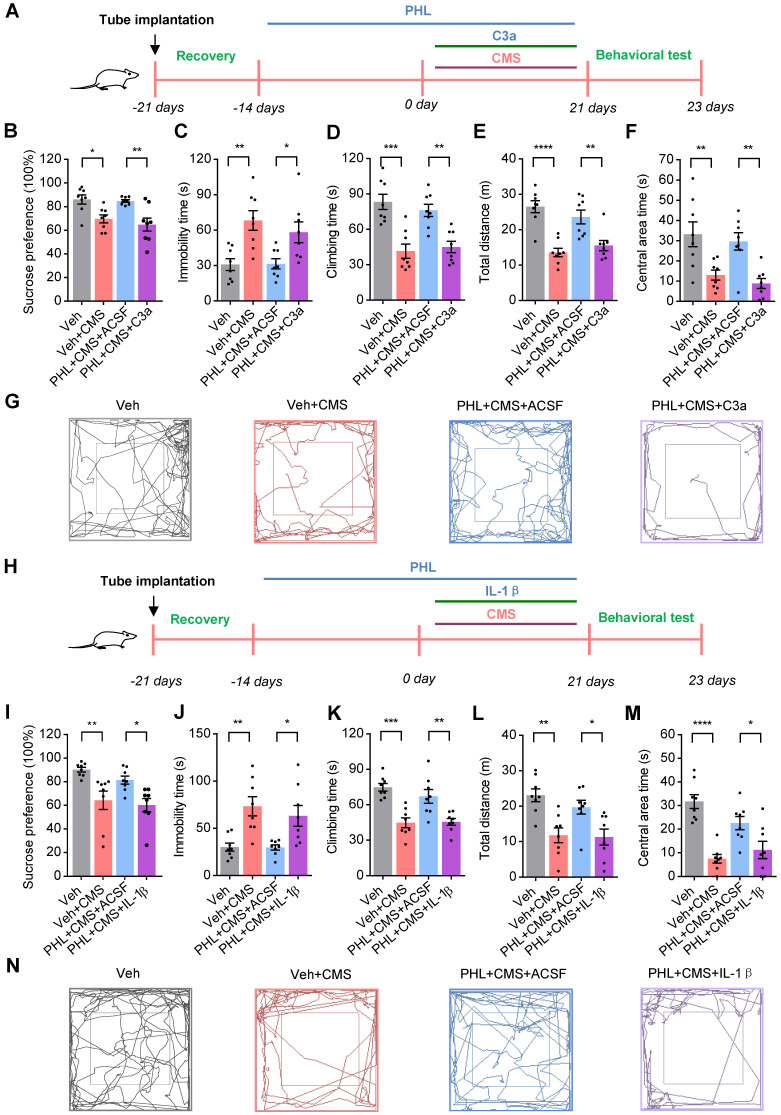
Figure 8.
PHL represses the NF-κB-C3 axis to prevent the CMS-induced depressive-like behaviors in the mPFC. (A) Schematic diagrams of the C3a injection and behavioral tests. (B) Sucrose preference was measured after the injection of C3a (n = 8 rats per group). (C-D) The FST was evaluated after the injection of C3a (n = 8 rats per group). The immobility time spent in the FST (C). The climbing time spent in the FST (D). (E-F) The OFT was performed after the injection of C3a (n = 8 rats per group). The total distance traveled in the open field area (E). Time spent in the center (F). (G) Representative animal traces of rat movement in the OFT after the injection of C3a. (H) Schematic diagrams of the IL-1β injection and behavioral tests. (I) Same as in (B) but injection of IL-1β. (J-K) Same as in (C-D) but injection of IL-1β. (L-M) Same as in (E-F) but injection of IL-1β. (N) Representative animal traces of rat movement in the OFT after the injection of IL-1β. Data are shown as mean ± SEM. One-way ANOVA with the Tukey's post hoc test (B-F, I-M). ∗p < 0.05, ∗∗p < 0.01, ∗∗∗p < 0.001, ∗∗∗∗p < 0.0001.

