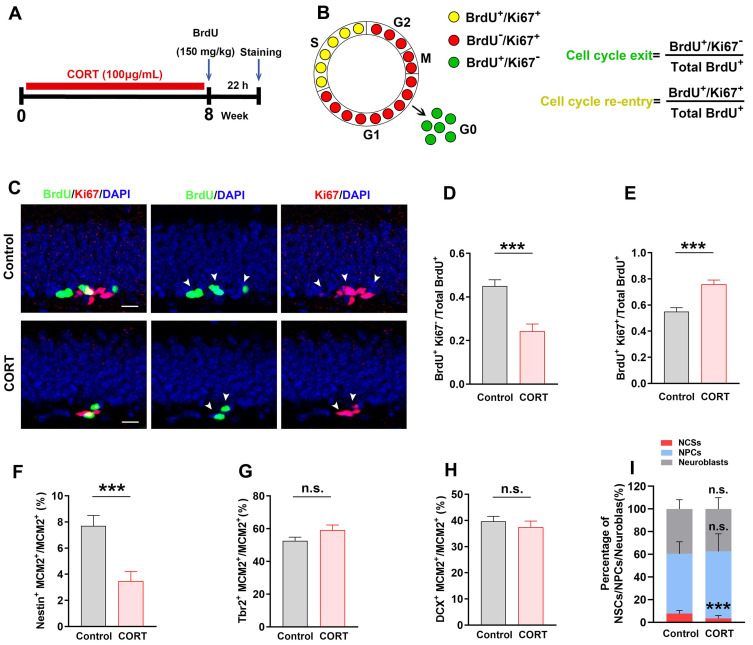
Figure 3.
Chronic CORT treatment impairs the cell cycle kinetics of NSCs. (A) Timeline of the experimental procedure, including BrdU administration. (B) Schematic diagram showing how BrdU and Ki67 co-labeling reflects the different stages of the cell cycle. The equations for calculating the index of cell cycle exit and re-entry are shown at the right. (C) Representative images of the control and CORT DG with double immunostaining of BrdU+ (green) and Ki67+ (red). White arrowheads indicate Ki67+/BrdU+ cells. (D) Quantification of BrdU+Ki67-/total BrdU+ cells. n = 7 mice per group, P < 0.0001. (E) Quantification of BrdU+Ki67+/total BrdU+ cells. n = 7 mice per group, P < 0.0001. (F) Quantification of Nestin+MCM2+/MCM2+ cells. n = 3 mice per group, P = 0.0006. (G) Quantification of Tbr2+MCM2+/MCM2+ cells. n = 4 mice per group, P = 0.9473. (H) Quantification of DCX+MCM2+/MCM2+ cells. n = 3 mice per group, P = 0.2207. (I) The proportion of NSCs, NPCs, and neuroblasts among all proliferating cells (NSCs + NPCs + neuroblasts) in the DG of CORT and control mice. n = 3 mice per group, P = 0.0007. Scale bar = 20 μm. Data are presented as the mean ± SEM. Two-tailed unpaired t-test was used to identify statistically significant differences between datasets (*P < 0.05, ***P < 0.001 compared to the control group). n.s., non-significant difference.

