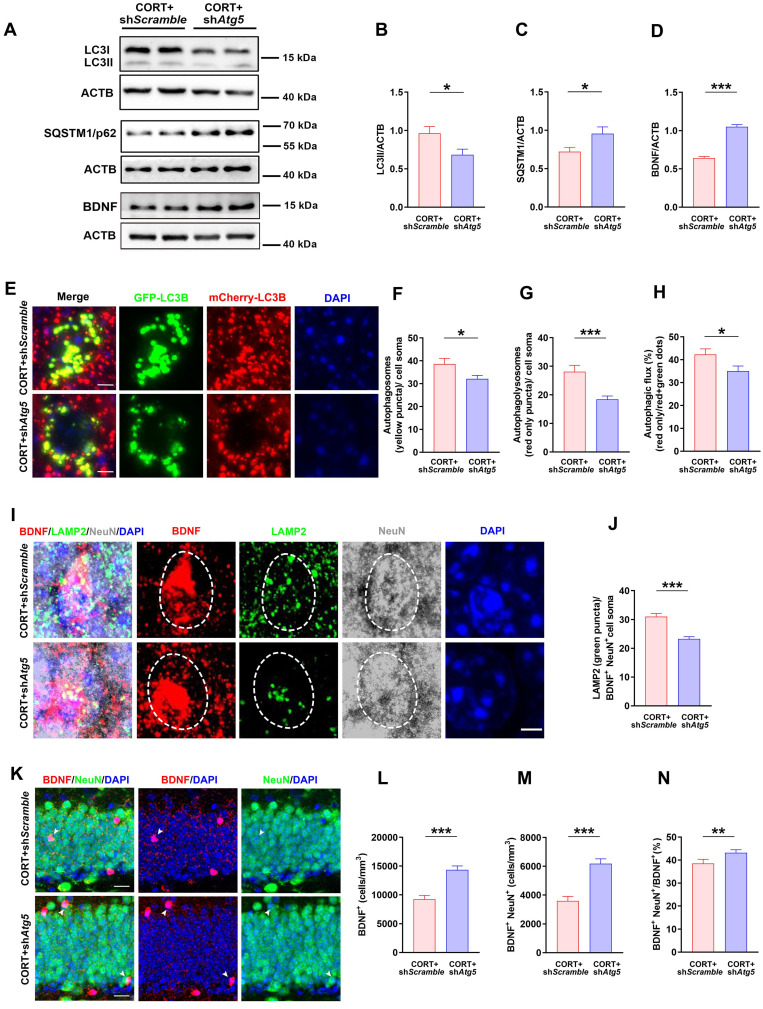
Figure 6.
Inhibiting increases in neuronal autophagy reduces lysosomal degradation of neuronal BDNF and increases neuronal BDNF expression in mice. (A) Representative western blots analyzing protein expression in the CORT+shScramble and CORT+shAtg5 groups. (B) Quantification of LC3II expression. n = 3 mice per group, P = 0.0222. (C) Quantification of SQSTM1/p62 expression. n= 3 mice per group, P = 0.0327. (D) Quantification of BDNF expression. n= 3 mice per group, P < 0.0001. (E) Representative images of AAV-expressed mCherry-GFP-LC3 in the CORT+shScramble and CORT+shAtg5. (F) Quantification of autophagosomes (yellow puncta) in cell soma. n = 4 mice per group, P = 0.0482. (G) Quantification of autolysosomes (red-only puncta) in cell soma. n = 4 mice per group, P = 0.0007. (H) Quantification of autophagic flux. n = 4 mice per group, P = 0.0336. (I) Representative images of DG from CORT+shScramble and CORT+shAtg5 mice with triple immunostaining of BDNF+ (red), LAMP2+ (green), and NeuN+ (gray) cells. Dashed circles indicate BDNF+ neurons. (J) Quantification of the number of LAMP2 puncta (green) in BDNF+NeuN+ cell soma. n= 3 mice per group, P < 0.0001. (K) Representative images of DG in CORT+shScramble and CORT+shAtg5 mice with double immunostaining of BDNF+ (red) and NeuN+ (green) cells. Arrowheads indicate BDNF+NeuN+ cells. (L) Quantification of BDNF+ cells. n = 3 mice per group, P < 0.0001. (M) Quantification of BDNF+NeuN+ cells. n = 3 mice per group, P < 0.0001. (N) Quantification of BDNF+NeuN+ cells/total BDNF+ cells. n = 3 mice per group, P = 0.0453. Data are presented as the mean ± SEM. Scale bar = 5 μm (Figure 6E and 6I). Scale bar = 20 μm (Figure 6K). Two-tailed unpaired t-test was used to identify statistically significant differences between datasets (*P < 0.05, **P < 0.01, ***P < 0.001 compared to CORT+shScramble group).

