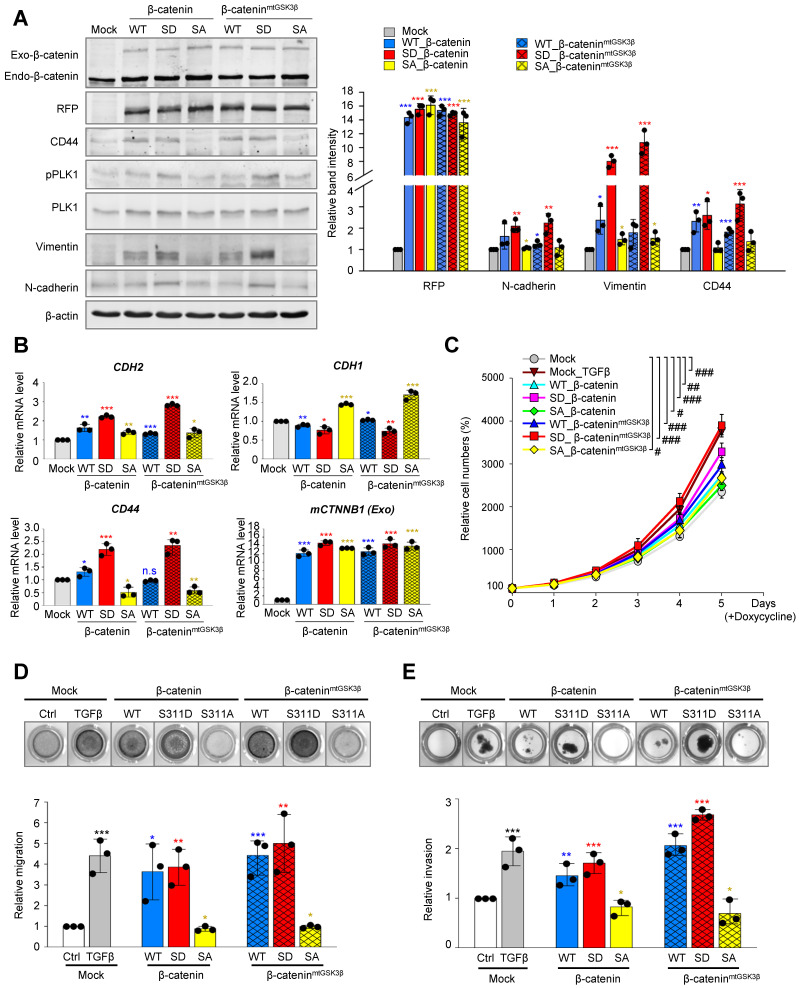
Figure 4.
Phosphorylated β-catenin promotes cell mobility and invasiveness of NSCLC. A-B, RFP-tagged wild-type (WT), S311D, or S311A of β-catenin and WT at S311, S311D, S311A of β-cateninmtGSK3β (S33/S37/T41/S45A) mutants were expressed in A549 cells. A549 cells were treated with doxycycline to express RFP-tagged β-catenin. A, Immunoblotting was performed using specific antibodies for β-catenin, RFP, CD44, PLK1, p-PLK1, vimentin, N-cadherin, and β-actin (left panel). The band intensity values were quantified using densitometry of Photoshop software, normalized, and plotted (right panel). B, qRT-PCR was performed for CDH1, CDH2, CD44, and CTNNB1 in A549 cells expressing wild-type or mutant β-catenin. *p <0.05; **p <0.01; ***p <0.001; (n=3). Data are presented as mean ± SD. C, Cell proliferation assay was performed (n=3). Data are presented as mean ± SD of at least three independent experiments. #, p < 0.05; ##, p <0.01; ###, p <0.001 compared with indicated groups of cells. D, Cells expressing wild-type or mutants of β-catenin were subjected to a Transwell migration assay. As a positive control for migration, cells were treated with TGF-β. Three days after seeding, the cells on the bottom layer surface were stained with 0.05% crystal violet dye. Images of the Transwell cell migration assay were collected and analyzed with an Odyssey infrared imaging system (LI-COR Biosciences) and plotted. *p <0.05; **p <0.01; ***p <0.001 compared with experimental control. E, An invasion assay was performed using A549 cells expressing wild-type or mutants of β-catenin. Fourteen days after seeding, the cells that invaded the bottom layer surface were stained with 0.05% crystal violet dye, and the relative absorbance was plotted. Data are presented as mean ± SD of at least three independent experiments (significantly different compared with experimental control). *p <0.05; **p <0.01; ***p <0.001.

