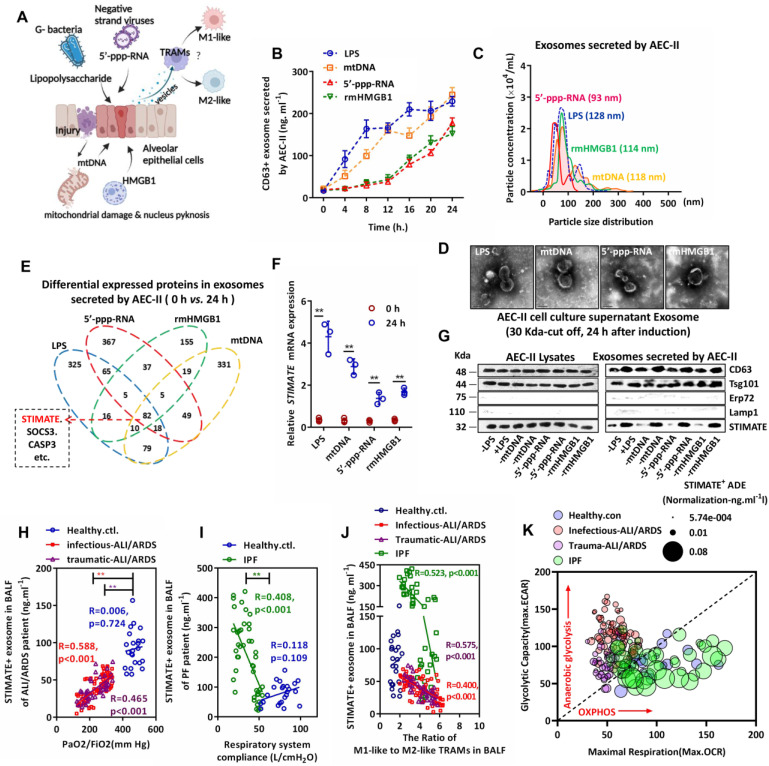
Figure 1.
Characterization and clinical monitoring of STIMATE+ exosomes released by human AEC-IIs. (A)Schematic diagram of mouse AEC-II perturbed by endogenous or exogenous risk factors and crosstalk with TRAMs through exosome secretion. (B)The time-dependent quantitative polyline of CD63+ exosomes released by mouse primary mouse AEC-IIs stimulated by LPS & rmHMGB1 and transfected mtDNA & 5'-pppRNA (n = 6), drawn according to the standard curve of recombinant CD63. (C)A NanoSight nanoparticle tracking system characterizes the release of ultrafiltration centrifugation of exosomes from mouse AEC-IIs stimulated by LPS & rmHMGB1 and mtDNA & 5'-pppRNA. (D)Representative TEM image of mouse AEC-IIs-releasing exosomes purified by ultrafiltration centrifugation. (E)Venn diagram of the overlap of differential protein cargo in mouse AEC-IIs release of exosomes by proteomics analysis stimulated by LPS & rmHMGB1 and transfected by mtDNA & 5'-pppRNA. (F)STIMATE mRNA in mouse AEC-II cells detected by qPCR in the presence or absence of LPS & rmHMGB1 and mtDNA & 5'-pppRNA (n = 3). (G)Representative Western blotting image of STIMATE protein expression in mouse AEC-IIs and exosomes (n = 3). CD63 and Tsg101 represent Exo-specific markers, and ERP27 and Lamp1 represent ER and lysosomal contamination markers, respectively. (H)STIMATE-positive AEC-IIs-derived exosomes (STIMATE+ ADEs) in lung BALF from healthy subjects (n = 23), infectious ALI/ARDS patients (n = 72) and traumatic ALI/ARDS patients (n = 40) were detected by exosome-based ELISA. The abscissa is the PaO2/FiO2 (representing the ventilation capacity) when the BALF sample was collected from each patient. Linear correlation between STIMATE+ Exo concentration and PaO2/FiO2 was analyzed by Pearson's correlation. (I)STIMATE+ ADEs in lung BALF from healthy subjects (n = 23) and interstitial PF patients (n = 44). The abscissa axis is the ventilator records of respiratory system compliance (Rsc, represents lung tension) of each patient. Linear correlation between STIMATE+ Exo concentration and Rsc was analyzed by Pearson's correlation. (J) The ratios of M1-like to M2-like TRAMs in lung BALF from healthy subjects (n = 23), infectious ALI/ARDS patients (n = 72), traumatic ALI/ARDS patients (n = 40) and interstitial PF patients (n = 44). (K)Maximal OCR plotted against maximal ECAR from the data in (Supplementary materials Figure S3C and S3D), and the bubble size indicates the relative amount of STIMATE+ ADEs.Data are shown as the mean ± SD, *p < 0.05 and **p < 0.01 by Student's t test (f), analysis of variance (ANOVA) followed by a post hoc test (i) or Pearson correlation analysis (j, k, l). All cell experiment data were derived from 3 independent experiments.

