Figure 5.
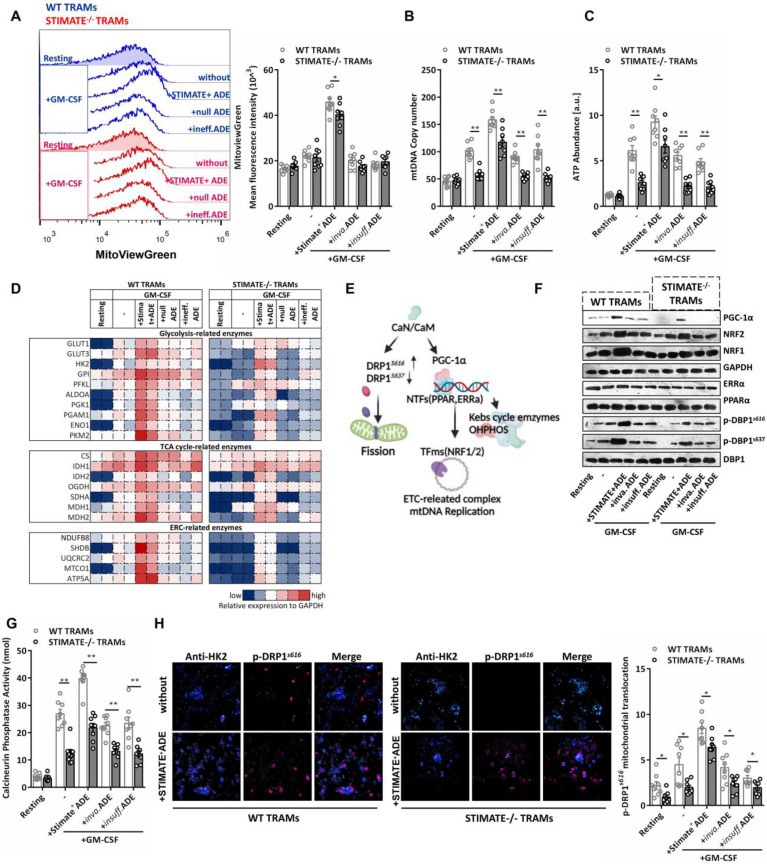
STIMATE+ ADE affects the TRAM CaN-PGC-α pathway and mitochondrial biogenesis. (A) Flow cytometry analysis of the mitochondrial volume by MitoViewGreen Fluorescence staining in WT or STIMATE-/- mouse TRAMs preincubated with STIMATE+ ADE, Inva.ADE and Insuff.ADE for 12 h before rmGM-CSF induction (n = 8). The right figure shows the MFI (495 nm absorption wavelength/516 nm emission wavelength) quantification of MitoViewGreen in TRAMs. (B and C) mtDNA copy number and ATP abundance by qPCR and LC-MS in WT or STIMATE-/- mouse TRAMs preincubated with STIMATE+ ADE, Inva.ADE and Insuff.ADE for 12 h before rmGM-CSF induction (n = 8). (D) The expression of key glycolytic metabolic enzymes, TAC enzymes and ETC enzymes in WT or STIMATE-/- mouse TRAMs by prefabricated custom antibody arrays and preincubated with STIMATE+-ADE, Inva.ADE and Insuff.ADE for 12 h before rmGM-CSF induction (n = 2). The panel is the heatmap drawn after normalizing the fluorescence intensity data of each point. (E) Schematic diagram of the involvement of PGC-1α and CaN in mitochondrial biogenesis, mitochondrial DNA replication, and mitochondrial fission. (F) Representative western blotting images of PGC-1α, PPARα, ERRα, NRF1 and NRF2 expression in WT or STIMATE-/- mouse TRAMs preincubated with STIMATE+-ADE, Inva.ADE and Insuff.ADE for 12 h before rmGM-CSF induction. GAPDH was used as an internal reference. Phosphorylated DRP1S616 and p-DRP1S637 were also detected, with DRP1 as an internal control. (G) Standard colorimetric assay to detect CaN enzyme activity in WT or STIMATE-/- mouse TRAMs preincubated with STIMATE+-ADE, Inva.ADE and Insuff.ADE for 12 h before rmGM-CSF induction (n = 8). (H) Representative CLSM of the recruitment of DRP1s616 to the mitochondrial outer membrane (anti-HK2) in WT or STIMATE-/- TRAMs preincubated with STIMATE+-ADE, Inva.ADE and Insuff.ADE for 12 h before rmGM-CSF induction (n = 8). The bar graph shows the quantification of the indicated number of cells showing DRP1s616 translocation to the mitochondria. Scale bar, 1 μm. Data are shown as the mean ± SD, *p < 0.05 and **p < 0.01 by analysis of variance (ANOVA) followed by a post hoc test compared to resting TRAMs. All data were derived from 3 independent experiments.

