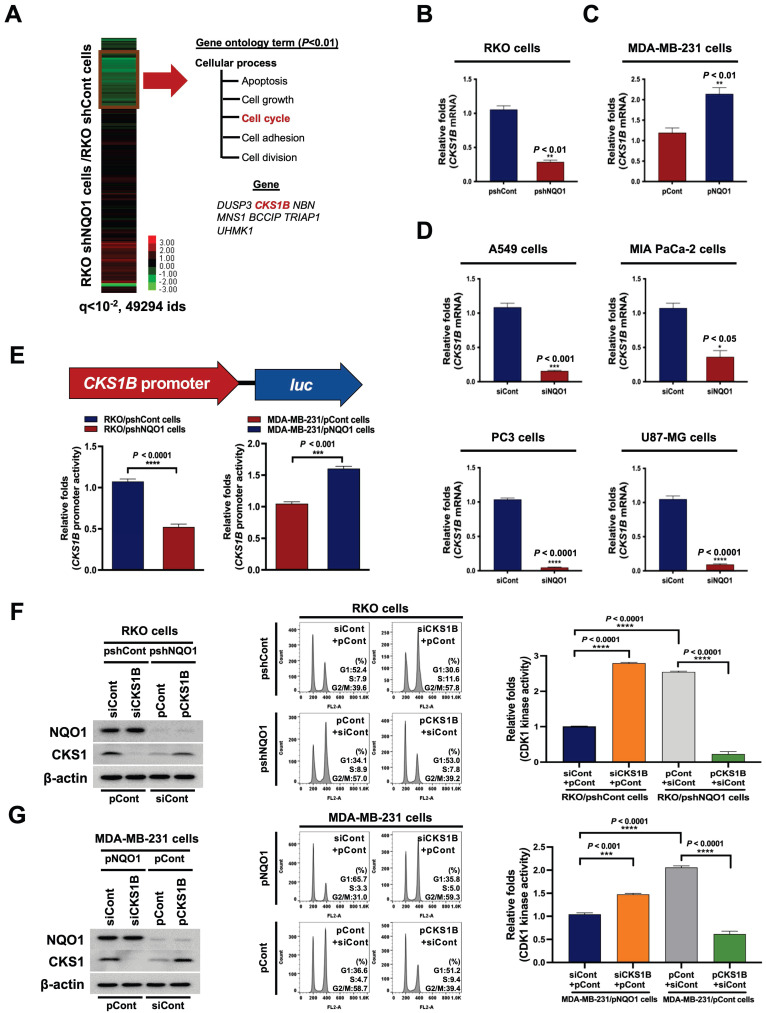
Figure 3.
NQO1 regulates CKS1-mediated cell cycle progression at the G2/M phase in cancer cells. (A) Heatmap representation of microarray data on gene levels in RKO/pshCont and RKO/pshNQO1 cells. (B-C) Relative mRNA levels of CKS1B in RKO/pshCont and RKO/pshNQO1 cells (B) and MDA-MB-231/pNQO1 and MDA-MB-231/pCont cells (C). CKS1B expression was examined via qPCR using 18S rRNA as the internal control. All data are presented as mean ± SEM. ** P < 0.01 with unpaired t-test. (D) Relative mRNA levels of CKS1B in A549, MIA-PaCa-2, PC3, and U87-MG cells. CKS1B expression was examined via qPCR using 18S rRNA as the internal control. All data are presented as mean ± SEM. *P < 0.05 with unpaired t-test, *** P < 0.001 with unpaired t-test, **** P < 0.0001 with unpaired t-test. (E) RKO/pshCont and RKO/pshNQO1 cells (Left) and MDA-MB-231/pNQO1 and MDA-MB-231/pCont cells (Right) were transfected with pCKS1B promoter-luc or control pRL-luc. After 4 h, cells were washed with PBS and incubated with the appropriate medium for 48 h. Luciferase activity was normalized with that of Renilla (mean ± SEM). *** P < 0.001 with unpaired t-test, **** P < 0.001 with unpaired t-test. (F-G) RKO/pshCont cells (F) and MDA-MB-231/pNQO1 cells (G) were transfected with siCont and pCont or siCKS1B and pCont, and RKO/pshNQO1 cells (F) or MDA-MB-231/pCont cells (G) were transfected with pCont and siCont or pCKS1B and siCont. After 48 h of incubation, cells were synchronized via double-thymidine blocking, released for 9 h, and harvested. The indicated protein levels (Left), cell distribution (Mid) and CDK1 activities (Right) were analyzed using immunoblot analysis, flow cytometry and CDK1 kinase assay, respectively. All data are presented as mean ± SEM. *** P < 0.001 with ANOVA, **** P < 0.001 with ANOVA.

