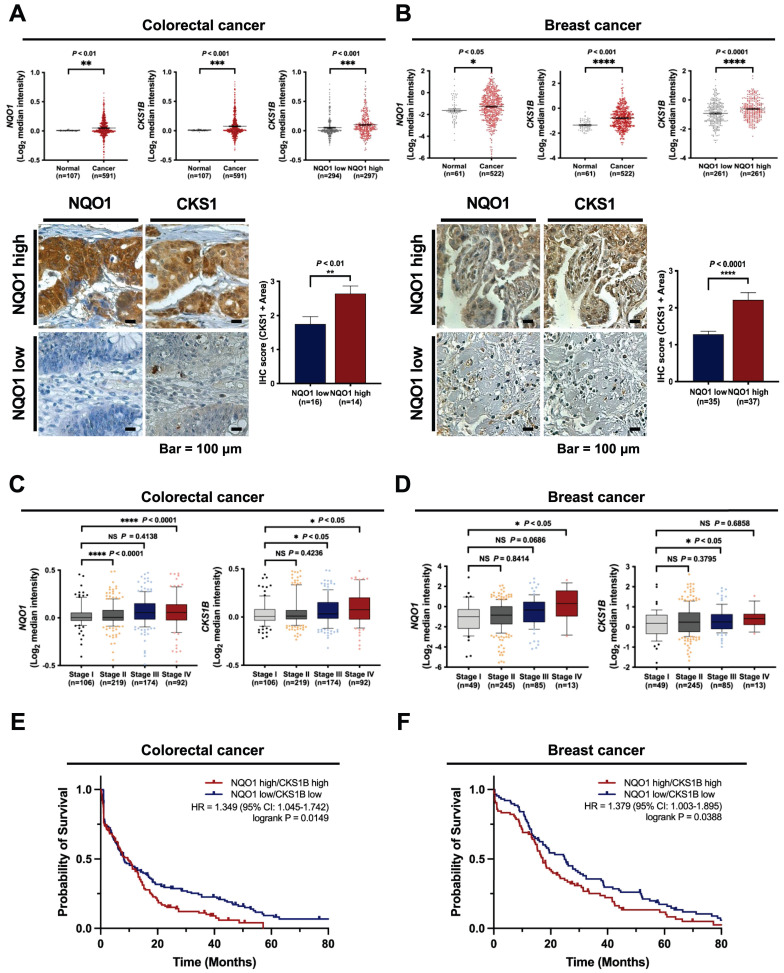
Figure 7.
NQO1 is correlated with CKS1B expression and poor prognosis in cancer. (A-B) Oncomine analysis of TCGA colorectal cancer (A) and TCGA breast cancer (B) databases showing elevated NQO1 (upper left) and CKS1B (upper mid) levels in colorectal cancer (n = 591) and breast cancer (522) compared to normal colorectal tissue (n = 107) and breast tissue (n = 61), respectively. * P < 0.05 with unpaired t-test. ** P < 0.01 with unpaired t-test. *** P < 0.001 with unpaired t-test. **** P < 0.0001 with unpaired t-test. Analysis of CKS1B expression relative to that of NQO1 in the Oncomine database (upper right). *** P < 0.001 with unpaired t-test. **** P < 0.0001 with unpaired t-test. Immunohistochemical detection (lower left) of CKS1 under conditions of high-level expression of NQO1 (Colorectal cancer, n=14; Breast cancer, n=37) compared to low-level expression of NQO1 (Colorectal cancer, n=16; Breast cancer, n=35). Positive area scores of NQO1 and CKS1 were determined in the most characteristic areas. The positive area score (lower right) of CKS1 was evaluated from 10 high magnification power fields (×40). Statistical analysis of the average CKS1 positive area score is shown in the right panel (Colorectal cancer, ** P < 0.01 with unpaired t-test; Breast cancer, **** P < 0.0001 with unpaired t-test). Bar = 100 μm. (C-D) Oncomine analysis of colorectal cancer (C) and breast cancer (D) showing that elevated NQO1 and CKS1 mRNA levels are correlated with advanced stages of colorectal and breast cancer. (E) NQO1 and CKS1 expression correlates with poor survival in colorectal cancer data set. Analysis of the colorectal cancer data set available through Oncomine indicates a significant correlation between the high-level expression of NQO1 and CKS1, and poor survival in the TCGA data set (n = 130 NQO1 high/CKS1 high, n = 151 NQO1 low/CKS1 low; P = 0.0149 with log-rank analysis). HR, hazard ratio; CI, confidence interval. (F) NQO1 and CKS1 expression correlates with poor survival in breast cancer data set. Analysis of the breast cancer data set available through Oncomine indicates a significant correlation between the high-level expression of NQO1 and CKS1, and poor survival in the TCGA data set (n = 84 NQO1 high/CKS1 high, n = 88 NQO1 low/CKS1 low; P = 0.0388 with log-rank analysis). HR, hazard ratio; CI, confidence interval.

