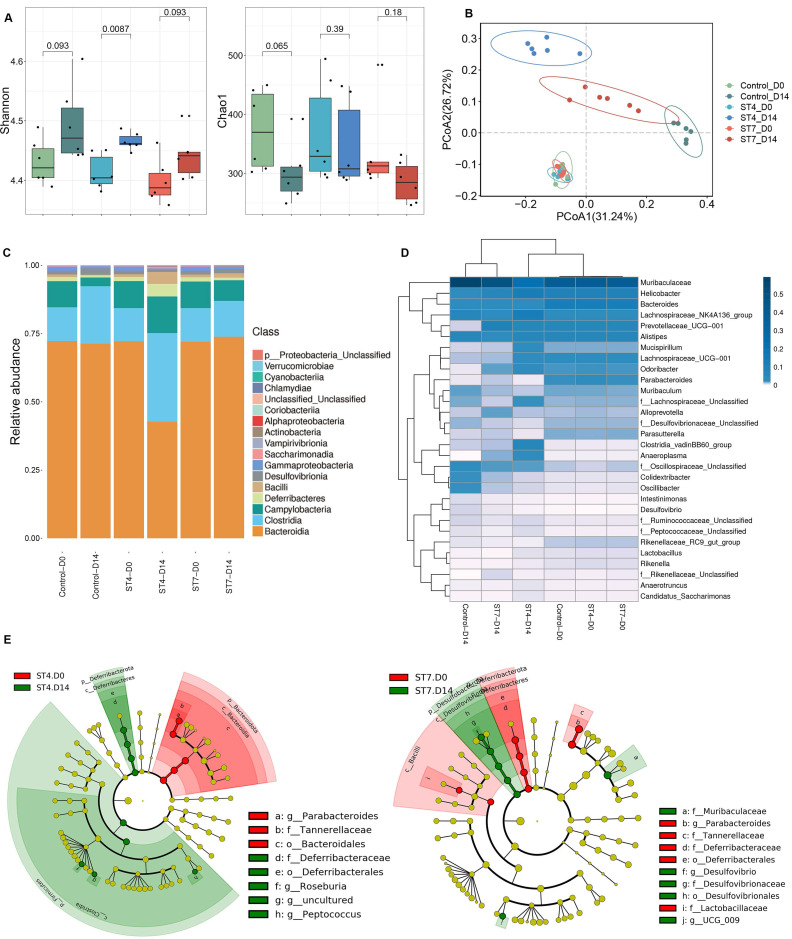
Figure 1.
Blastocystis ST4 and ST7 infection caused differential gut microbial signatures. (A) Alpha diversity was measured by Shannon and Chao1 indices (n = 6). (B) Principal co-ordinates analysis (PCoA) based on Bray-Curtis dissimilarities of fecal gut microbiota derived from control (green dots), ST4 (blue dots), and ST7 (red dots) mice at day 0 and day 14. (C) Relative abundance of the different taxa at the class level. (D) Heatmap showing Blastocystis ST4 and ST7-associated taxonomic markers at day 14. (E) LefSe analysis showed the differentially abundant bacterial taxa between ST4 and ST7 groups relative to the baseline. Data are representative of two independent experiments and shown as the mean ± SEM.

