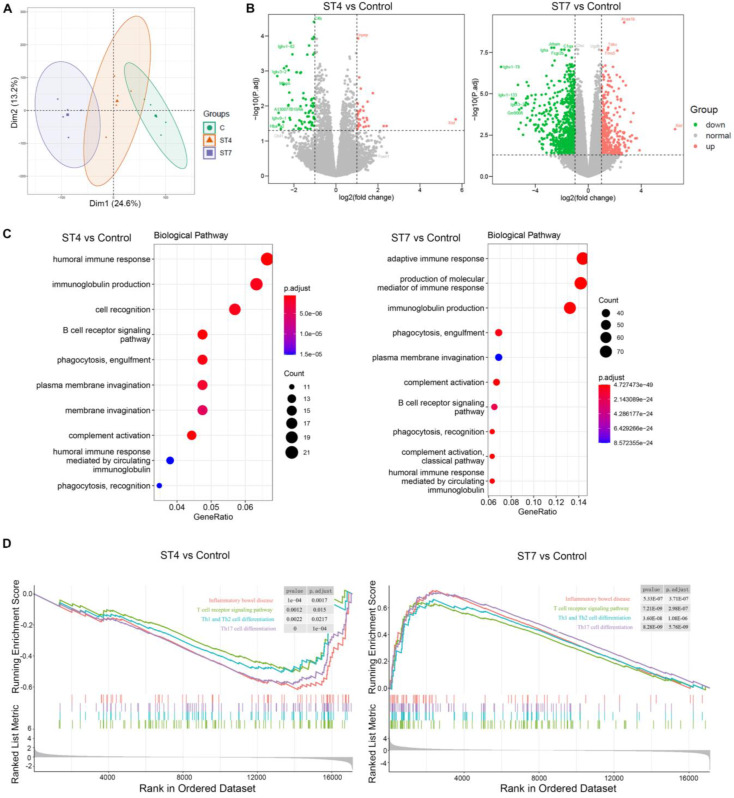
Figure 4.
Gene expression in ST4 and ST7-infected colon tissues after DSS treatment. (A) Principal component analysis (PCA) plot comparing mouse transcriptomes among control, ST4, and ST7 infected mice. (B) Volcano plots showing log2 fold change plotted against log of mean normalized expression counts. (C) The top 10 most enriched GO terms found in the analysis of DEGs in ST4 vs. Control group, and ST7 vs. Control group. GO terms were ranked by their significance. (D) GSEA analysis showed the gene sets of inflammatory bowel disease, T cell receptor signaling pathway, Th1 and Th2 cell differentiation, and Th17 cell differentiation. Graphs depict the enrichment score (y axis) with negative values where gene sets are inhibited, and positive values where they are induced. Each vertical bar on the x axis represents an individual gene within the gene set, and its relative ranking against all genes analyzed. P and Padj value is indicated on the graph.

