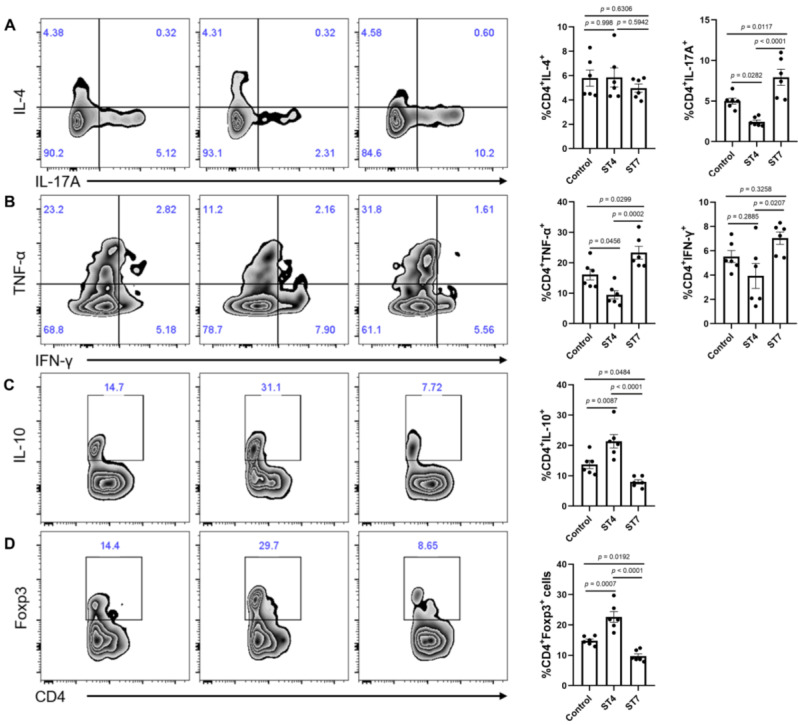
Figure 7.
Colonic immune profiles from recipient mice. (A) Zebra plots and bar charts show staining and the percentage of IL-4, and IL-17A within CD4+ T cells. (B) Zebra plots and bar charts show staining and the percentage of TNF-α, and IFN-γ within CD4+ T cells. Zebra plots and bar charts show staining and the percentage of IL-10 (C) and Foxp3 (D) within CD4+ T cells. Data are representative of two independent experiments and shown as the mean ± SEM. One-way ANOVA p-values adjusted for Tukey's multiple comparisons are shown.

