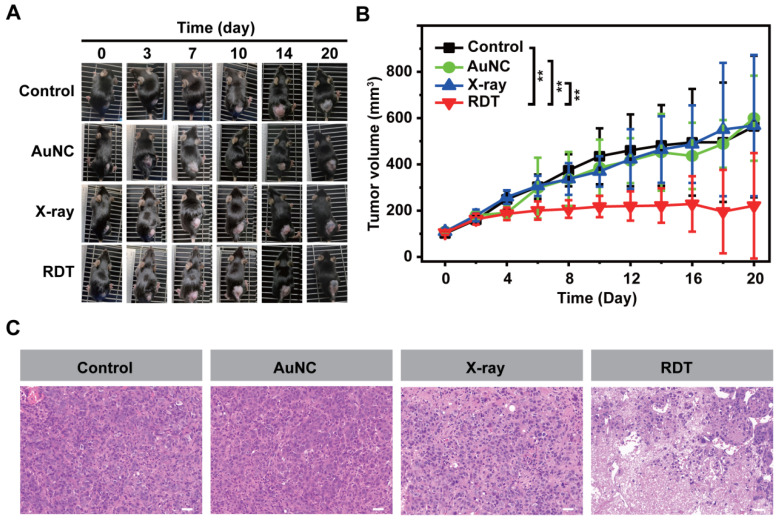
Figure 5.
In vivo AuNC@DHLA-based radiodynamic therapy. The day of injection was designated as day 0. (A) Photo images of Hepa 1-6 tumors in mice after different treatment. These mice injected only with PBS were designated as the control group. These mice irradiated with X-ray at dose of 0.25 Gy (1.0 Gy min-1), without AuNC@DHLA, were designated as the X-ray group. These mice injected with AuNC@DHLA (6.1 mg kg-1), without X-ray radiation, were designated as the AuNC group. These mice injected with AuNC@DHLA (6.1 mg kg-1) and irradiated with X-ray at dose of 0.25 Gy (1.0 Gy min-1) were designated as the RDT group. (B) Tumor growth curve of Hepa 1-6 tumor-bearing C57BL/6j mice from different groups within 20 days. Data are represented as mean ± SD (4 mice per group). Data were analyzed by two-tailed t-test (**p < 0.01). (C) Slices of H&E staining of tumors with different treatment.

