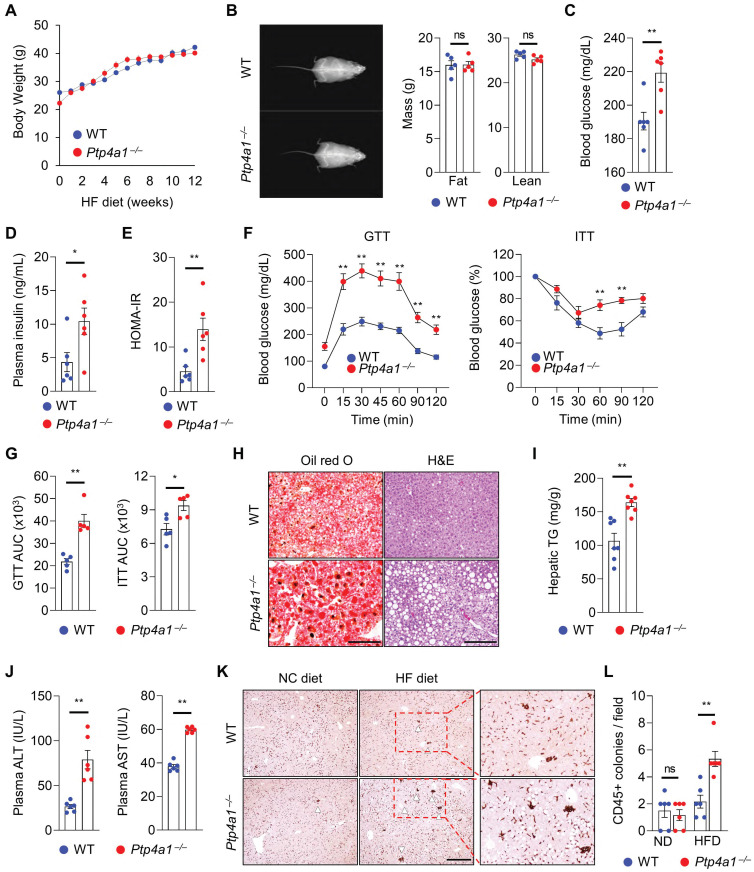
Figure 1.
Lacking PTP4A1 in mice exacerbates a high-fat (HF) diet-induced hyperglycemia and NAFLD. (A) Body weight (BW) gain of Ptp4a1-/- mice and wild-type (WT) littermates on an HF diet for 12 weeks (n = 7). (B) Representative images and the graphs for fat and lean mass in dual-energy X-ray absorptiometry analysis (n = 5). (C and D) The levels of blood glucose (C) and plasma insulin (D) of WT and Ptp4a1-/- mice fed an HF diet for 12 weeks (n = 6). (E) Homeostatic model assessment-insulin resistance (HOMA-IR) of WT and Ptp4a1-/- mice in fasting conditions (n = 6). (F) Glucose tolerance test (GTT) and insulin tolerance test (ITT) of WT and Ptp4a1-/- mice fed an HF diet for 12 weeks (n = 5). (G) The area under the curve (AUC) of GTT and ITT (n = 5). (H) The representative images for oil-red O and hematoxylin & eosin (H&E) staining in the livers from WT and Ptp4a1-/- mice fed an HF diet for 12 weeks (n = 7). Scale bar, 200 μm. (I) Hepatic triglyceride (TG) levels of WT and Ptp4a1-/- mice fed an HF diet for 12 weeks (n = 7). (J) The levels of alanine aminotransferase (ALT) and aspartate transaminase (AST) in plasma of WT and Ptp4a1-/- mice fed an HF diet for 12 weeks (n = 6). (K) The representative images for CD45 positive cells in the liver of WT and Ptp4a1-/- mice fed a normal chow (NC) or an HF diet (n = 6). Scale bar, 300 μm. The magnified images in the red dot boxes are presented on the right. (L) The quantitative graph for CD45 positive colonies per field in the liver of WT and Ptp4a1-/- mice fed an HF diet for 12 weeks (n = 6). Data are presented as the mean ± standard error of the mean. *P < 0.05, **P < 0.01, n.s., not significant (Mann-Whitney U test for B-E, G, I, and J, two-way ANOVA for F and L).

