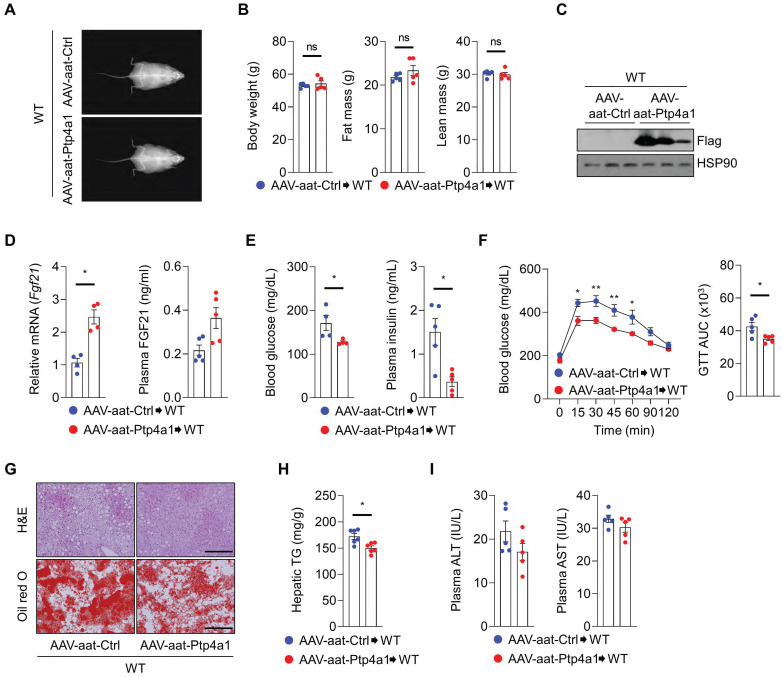
Figure 7.
Liver-specific PTP4A1 overexpression reduces hyperglycemia and NAFLD after feeding a high-fat (HF) diet in wild-type (WT) mice. (A and B) Representative images (A) and the graphs (B) for body weight, fat, and lean mass of WT mice administrated with adeno-associated virus (AAV)-aat-control (Ctrl) or AAV-aat-Ptp4a1 after feeding an HF diet for 12 weeks in dual-energy X-ray absorptiometry analysis (n = 5). (C) Immunoblot analysis in the liver lysates of WT mice administrated with AAV-aat-Ctrl or AAV-aat-Ptp4a1. HSP90 was used as a loading control. (D) The levels of Fgf21 mRNA in the liver (n = 4) and FGF21 in plasma (n = 5) of WT mice administrated with AAV-aat-Ctrl or AAV-aat-Ptp4a1 after feeding an HF diet. (E) Blood glucose levels (left, n = 4) and plasma insulin levels (right, n = 5) in WT mice administrated with AAV-aat-Ctrl or AAV-aat-Ptp4a1 after feeding an HF diet. (F) Glucose tolerance test (GTT) and the area under the curve (AUC) of GTT in WT mice administrated with AAV-aat-Ctrl or AAV-aat-Ptp4a1 after feeding an HF diet (n = 5). (G) The representative images for hematoxylin&eosin (H&E) staining and oil red O staining in the liver sections of WT mice administrated with AAV-aat-Ctrl or AAV-aat-Ptp4a1 after feeding an HF diet (n = 4). Scale bar, 200 μm. (H) Hepatic triglyceride (TG) levels in WT mice administrated with AAV-aat-Ctrl or AAV-aat-Ptp4a1 after feeding an HF diet (n = 6). (I) The levels of alanine aminotransferase (ALT) and aspartate transaminase (AST) in plasma of WT mice administrated with AAV-aat-Ctrl or AAV-aat-Ptp4a1 after feeding an HF diet (n = 5). Data are presented as the mean ± standard error of the mean. *P < 0.05, n.s., not significant (Mann-Whitney U test for B, D (right), E, F (right), H, and I; two‐tailed Student's t‐test for D (left); two-way ANOVA for F (left)).

