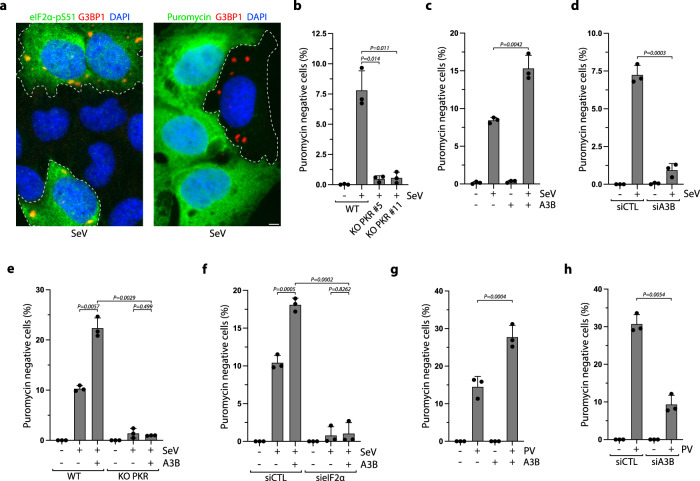
Fig. 4. A3B enhances PKR-mediated translation arrest.
a Representative immunofluorescence for G3BP1 and eIF2a-pS51 (left) or puromycin (right) in U2OS cells infected with SeV (MOI = 1, 24hpi). SG positive cells are marked with a dotted outline. Scale bar: 5 μm b Quantification of puromycin negative cells (%) in U2OS-A3B-Flag and U2OS-A3B-Flag PKR KO cells infected with SeV (MOI = 1, 24hpi). Mean values ± SD (Number of biological replicates, n = 3). P-values were calculated with a two-tailed Welch t-test. c Quantification of puromycin negative cells (%) in U2OS-A3B-flag cells ± DOX infected with SeV at 24hpi. Mean values ± SD (Number of biological replicates, n = 3). P-values were calculated with a two-tailed Welch t-test. d U2OS cells were transfected with siRNA against A3B for 40 h and subsequently infected with SeV at MOI = 1. At 24hpi, the levels of puromycin negative cells (%) were quantified by immunofluorescence. Mean values ± SD (Number of biological replicates, n = 3). P-values were calculated with a two-tailed Welch t-test. e U2OS-A3B-Flag WT or PKR KO cells ± DOX were infected with SeV at MOI = 1. At 24hpi, the levels of puromycin negative cells (%) were quantified by immunofluorescence. Mean values ± SD (Number of biological replicates, n = 3). P-values were calculated with a two-tailed Welch t-test. f Quantification of puromycin negative cells (%) in U2OS-A3B-flag cells ± DOX transfected with the indicated siRNA for 40 h and subsequently infected with SeV (MOI = 1, 24hpi). Mean values ± SD (Number of biological replicates, n = 3). P-values were calculated with a two-tailed Welch t-test. g U2OS-A3B-Flag cells ± DOX were infected with PV at MOI = 1. At 16hpi, the levels of puromycin negative cells (%) were quantified by immunofluorescence. Mean values ± SD (Number of biological replicates, n = 3). P-values were calculated with a two-tailed Welch t-test. h Quantification of puromycin negative cells (%) in U2OS cells knockdown for A3B and infected with PV (MOI = 1, 16hpi). Mean values ± SD (Number of biological replicates, n = 3). P-values were calculated with a two-tailed Welch t-test. Source data are provided as a Source Data file.

