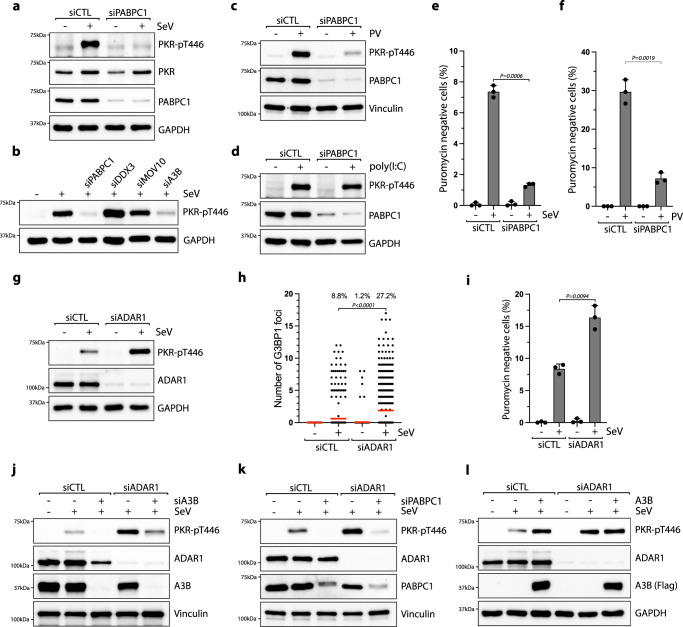
Fig. 5. APOBEC3B and PABPC1 counterbalance ADAR1 activity suppressing PKR.
a, b U2OS cells knocked down for 40 h with the indicated siRNAs were infected with SeV (MOI = 1, 24hpi) and the levels of PKR-pT446 and the indicated proteins were analyzed by western blotting. U2OS cells knocked down with a siRNA control (siCTL) or against PABPC1 for 40 h were infected with PV at MOI = 1 for 20 h (c) or transfected with 200 ng/mL poly(I:C) for 8 h (d). The levels of PKR-pT446, PABPC1, and vinculin were analyzed by western blotting. U2OS cells were transfected with siRNA against PABPC1 for 40 h and subsequently infected with SeV at MOI = 1 (e) or PV at MOI = 1 (f). At 24 hpi (SeV) or 16hpi (PV), the levels of puromycin negative cells (%) were quantified by immunofluorescence. Mean values ± SD (Number of biological replicates, n = 3). P-values were calculated with a two-tailed Welch t-test. g–i. U2OS cells knocked down with a siRNA control (siCTL) or against ADAR1 were infected with SeV at MOI = 1 for 24h. The levels of PKR-pT446 and the indicated proteins were analyzed by western blotting (g), and the number of G3BP1 foci in individual cells. (Red lines indicate the mean (Number of cells, n = 500)), (h) and the puromycin negative cells (Mean values ± SD (Number of biological replicates, n = 3)) (i) were quantified by immunofluorescence. P-values were calculated with a two-tailed Welch t-test. j, k U2OS cells knocked down with the indicated siRNAs were infected with SeV (MOI = 1, 24hpi) and the levels of PKR-pT446 were analyzed by western blotting. l U2OS-A3B-flag cells ± DOX and knocked down with siCTL or siADAR1 for 40 h were infected with SeV (MOI = 1, 24hpi) and the levels of PKR-pT446 and the indicated proteins were analyzed by western blotting. Source data are provided as a Source Data file.

