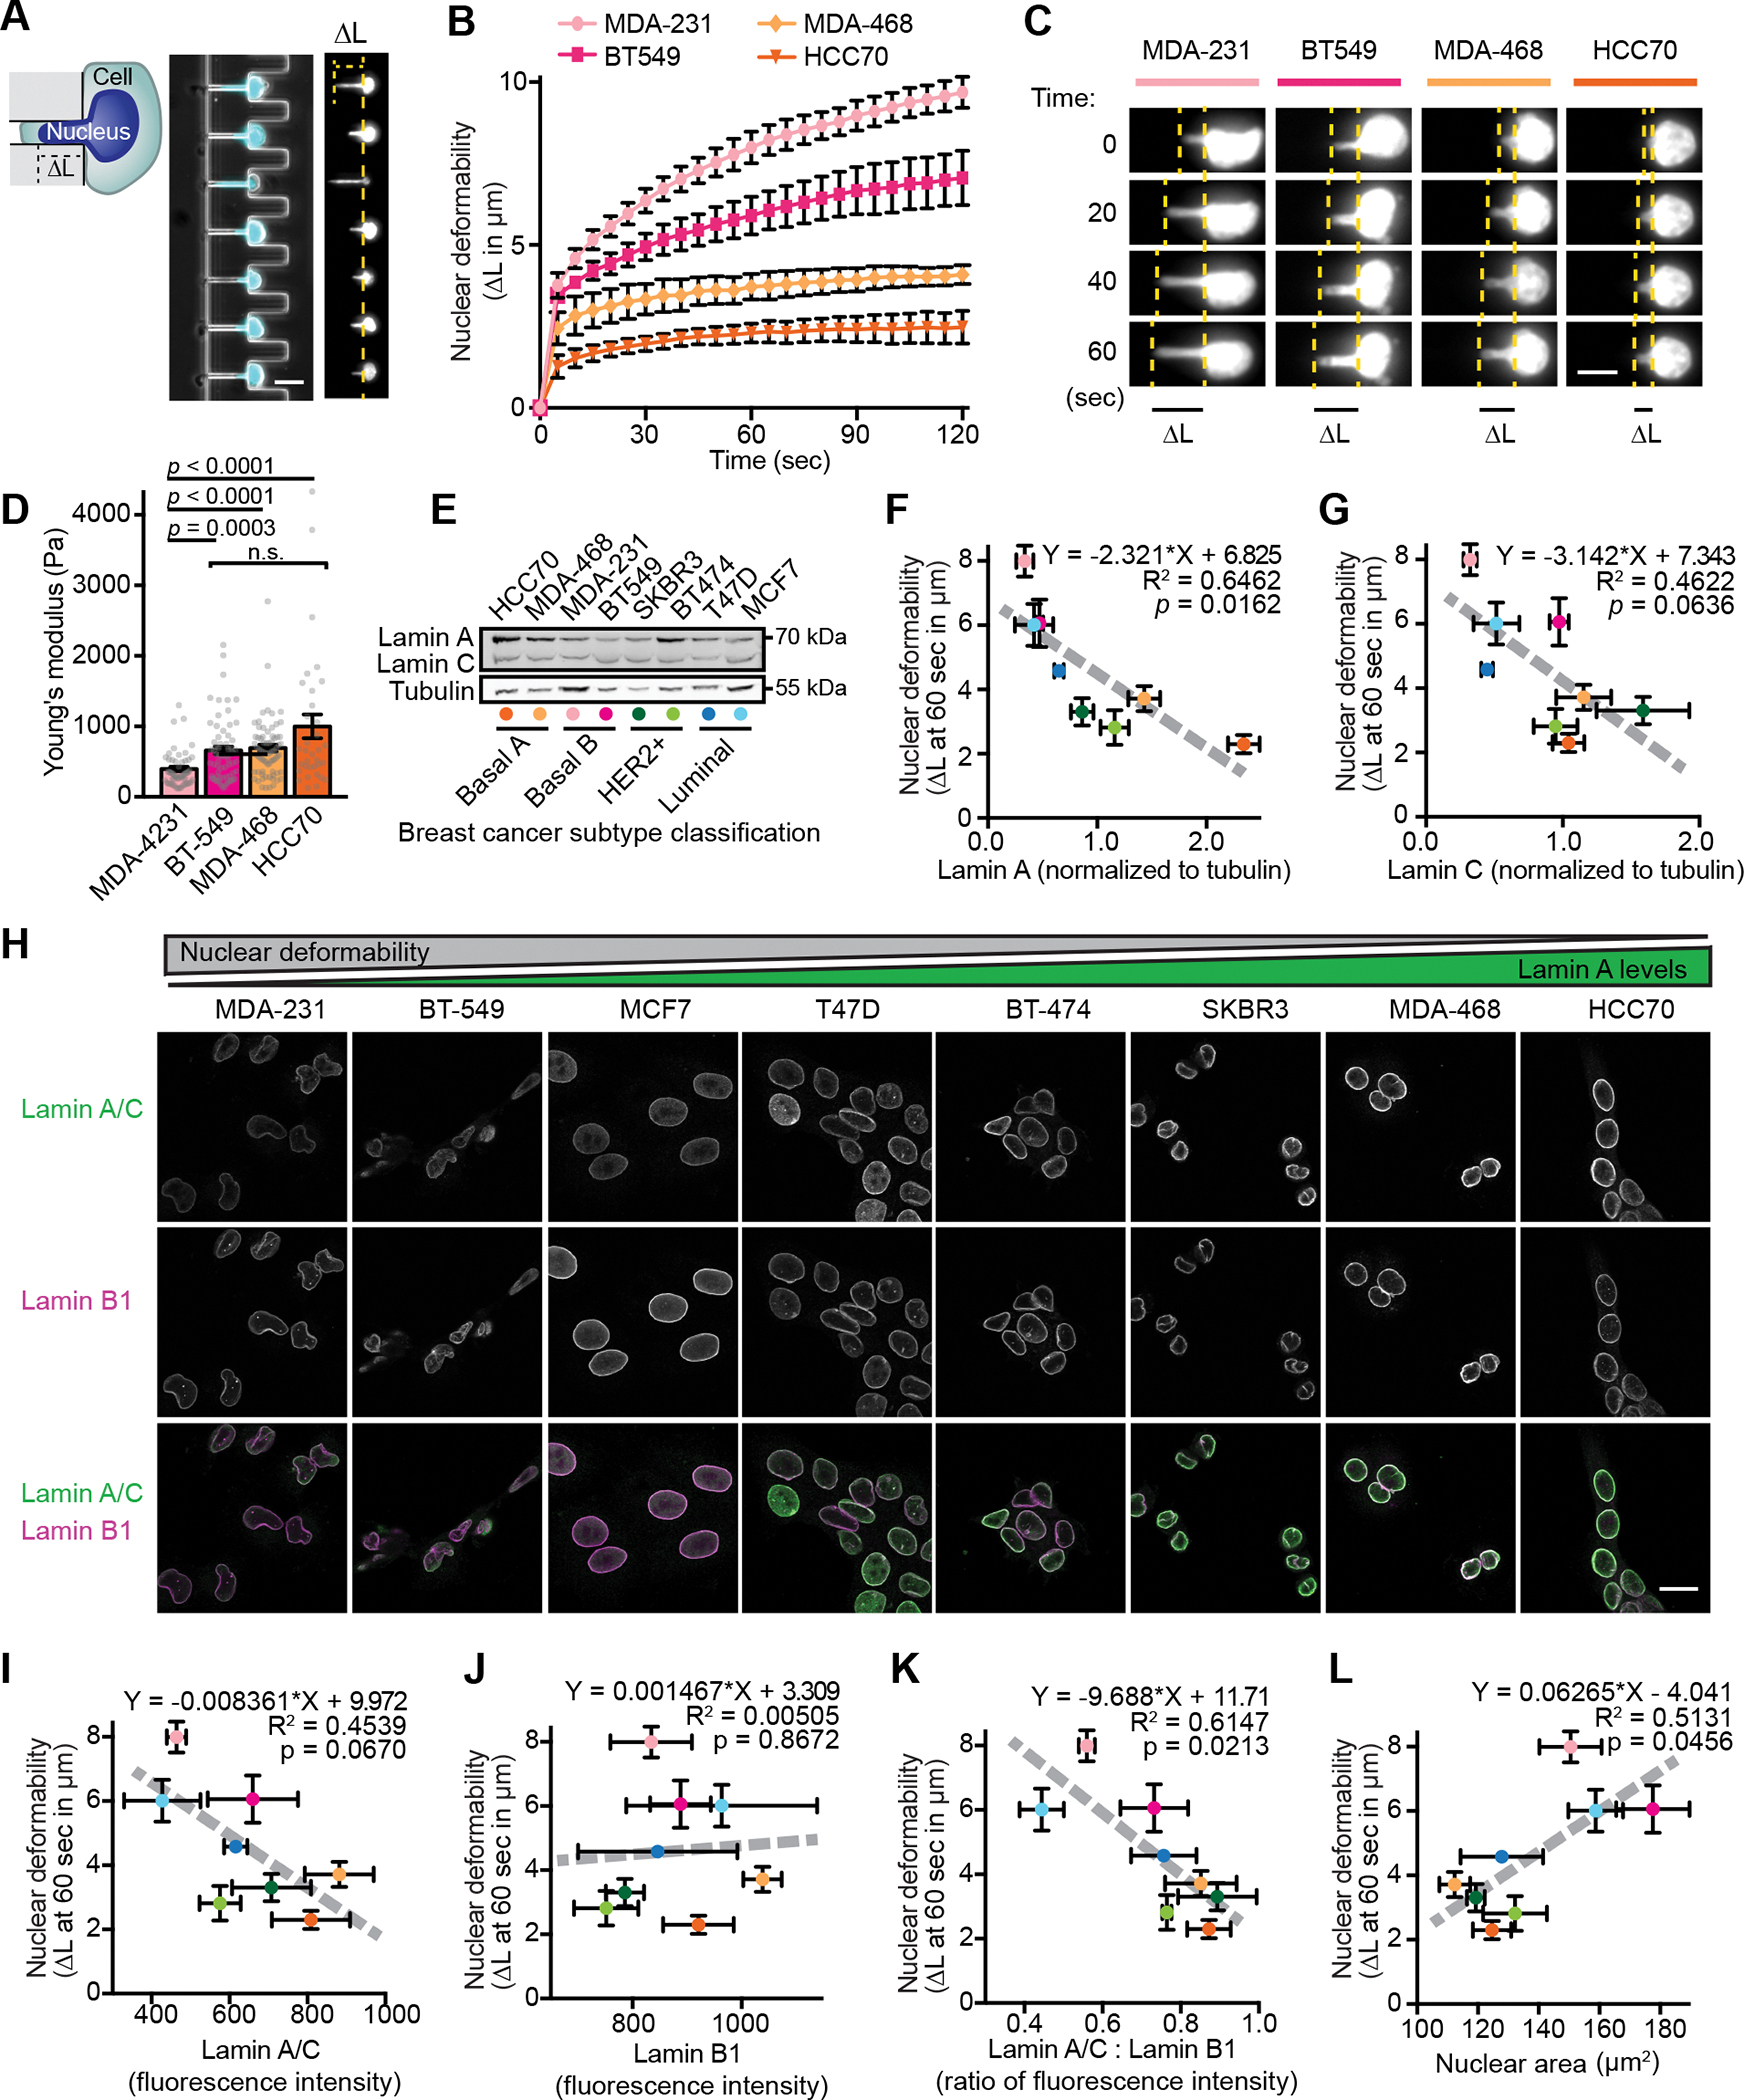
Figure 1. Nuclear size and stiffness vary widely across breast cancer cell lines and correspond to lamin A/C levels.

(A) Images and schematic of nuclear deformation into a microfluidic micropipette aspiration device under an externally applied pressure. The length of nuclear protrusion (ΔL) into the 3 × 5 μm2 channel was measured every 5 seconds at constant pressure application. Scale bar = 20 μm. (B) Nuclear protrusion curves for four representative human breast cancer cell lines with different degrees of nuclear deformability. N = 3 independent experiments with at least 13 individual measurements per cell line per replicate, mean ± SEM. (C) Representative time-lapse image series of deformation of fluorescently labeled nuclei of MDA-231, BT-549, MDA-468, and HCC70 cells in the microfluidic micropipette aspiration device. Scale bar = 10 μm. (D) Young’s elastic modulus was determined for the indicated cell lines using a Chiaro nanoindentation device and fitting force-indentations curves to a Hertz model. Data collected across two independent experiments (MDA-231 n = 51, BT-549 n = 68, MDA-468 n = 74, HCC70 n = 34). Data displayed as Mean ± SEM and statistical analysis using a Kruskal-Wallis test with Dunn’s multiple comparisons. (E) Representative example of Western blot for lamin A/C in a panel of human breast cancer cell lines. Breast cancer subtype classifications are indicated; colored dots correspond to the data for each cell line presented in panels F-G. Tubulin served as loading control. (F and G) Nuclear deformability shows an inverse correlation with lamin A (F) and lamin C (G) levels determined by western blot analysis (N = 3). Mean ± SEM. Deformability measurements were taken as nuclear protrusion (ΔL) after 60 seconds of micropipette aspiration in a microfluidic device (N = 3 independent experiments, 5–61 measurements per cell type per replicate as shown in Figure S1C). The linear regression results are indicated on each graph. (H) Representative examples depicting lamin A/C and lamin B1 immunolabeling for each human breast cell line studied. Scale bar = 20 μm. (I-K) Quantification of lamin intensity at the nuclear rim by immunofluorescence (N = 3 independent experiments with a minimum of 46 measurements per cell line in each experiment) reveals an inverse correlation between nuclear deformability and A-type lamin levels or lamin A/C: lamin B1 ratio, but not for lamin B1 alone. Deformability measurements same as in panels F-G. Data are plotted as mean ± SEM; the linear regression results are indicated on each graph. (L) Larger nuclear cross-sectional area correlates with increased nuclear deformability. Quantification of nuclear cross-sectional area of trypsinized cells in suspension (N = 3 independent experiments with a minimum of 20 measurements per cell line per replicate, Mean ± SEM). Deformability measurements same as in panels F-G. Linear regression analysis is indicated on each graph.
