
Figure 2. Decreased A-type lamin levels result in the enhanced nuclear deformability of invasive breast cancer cells.
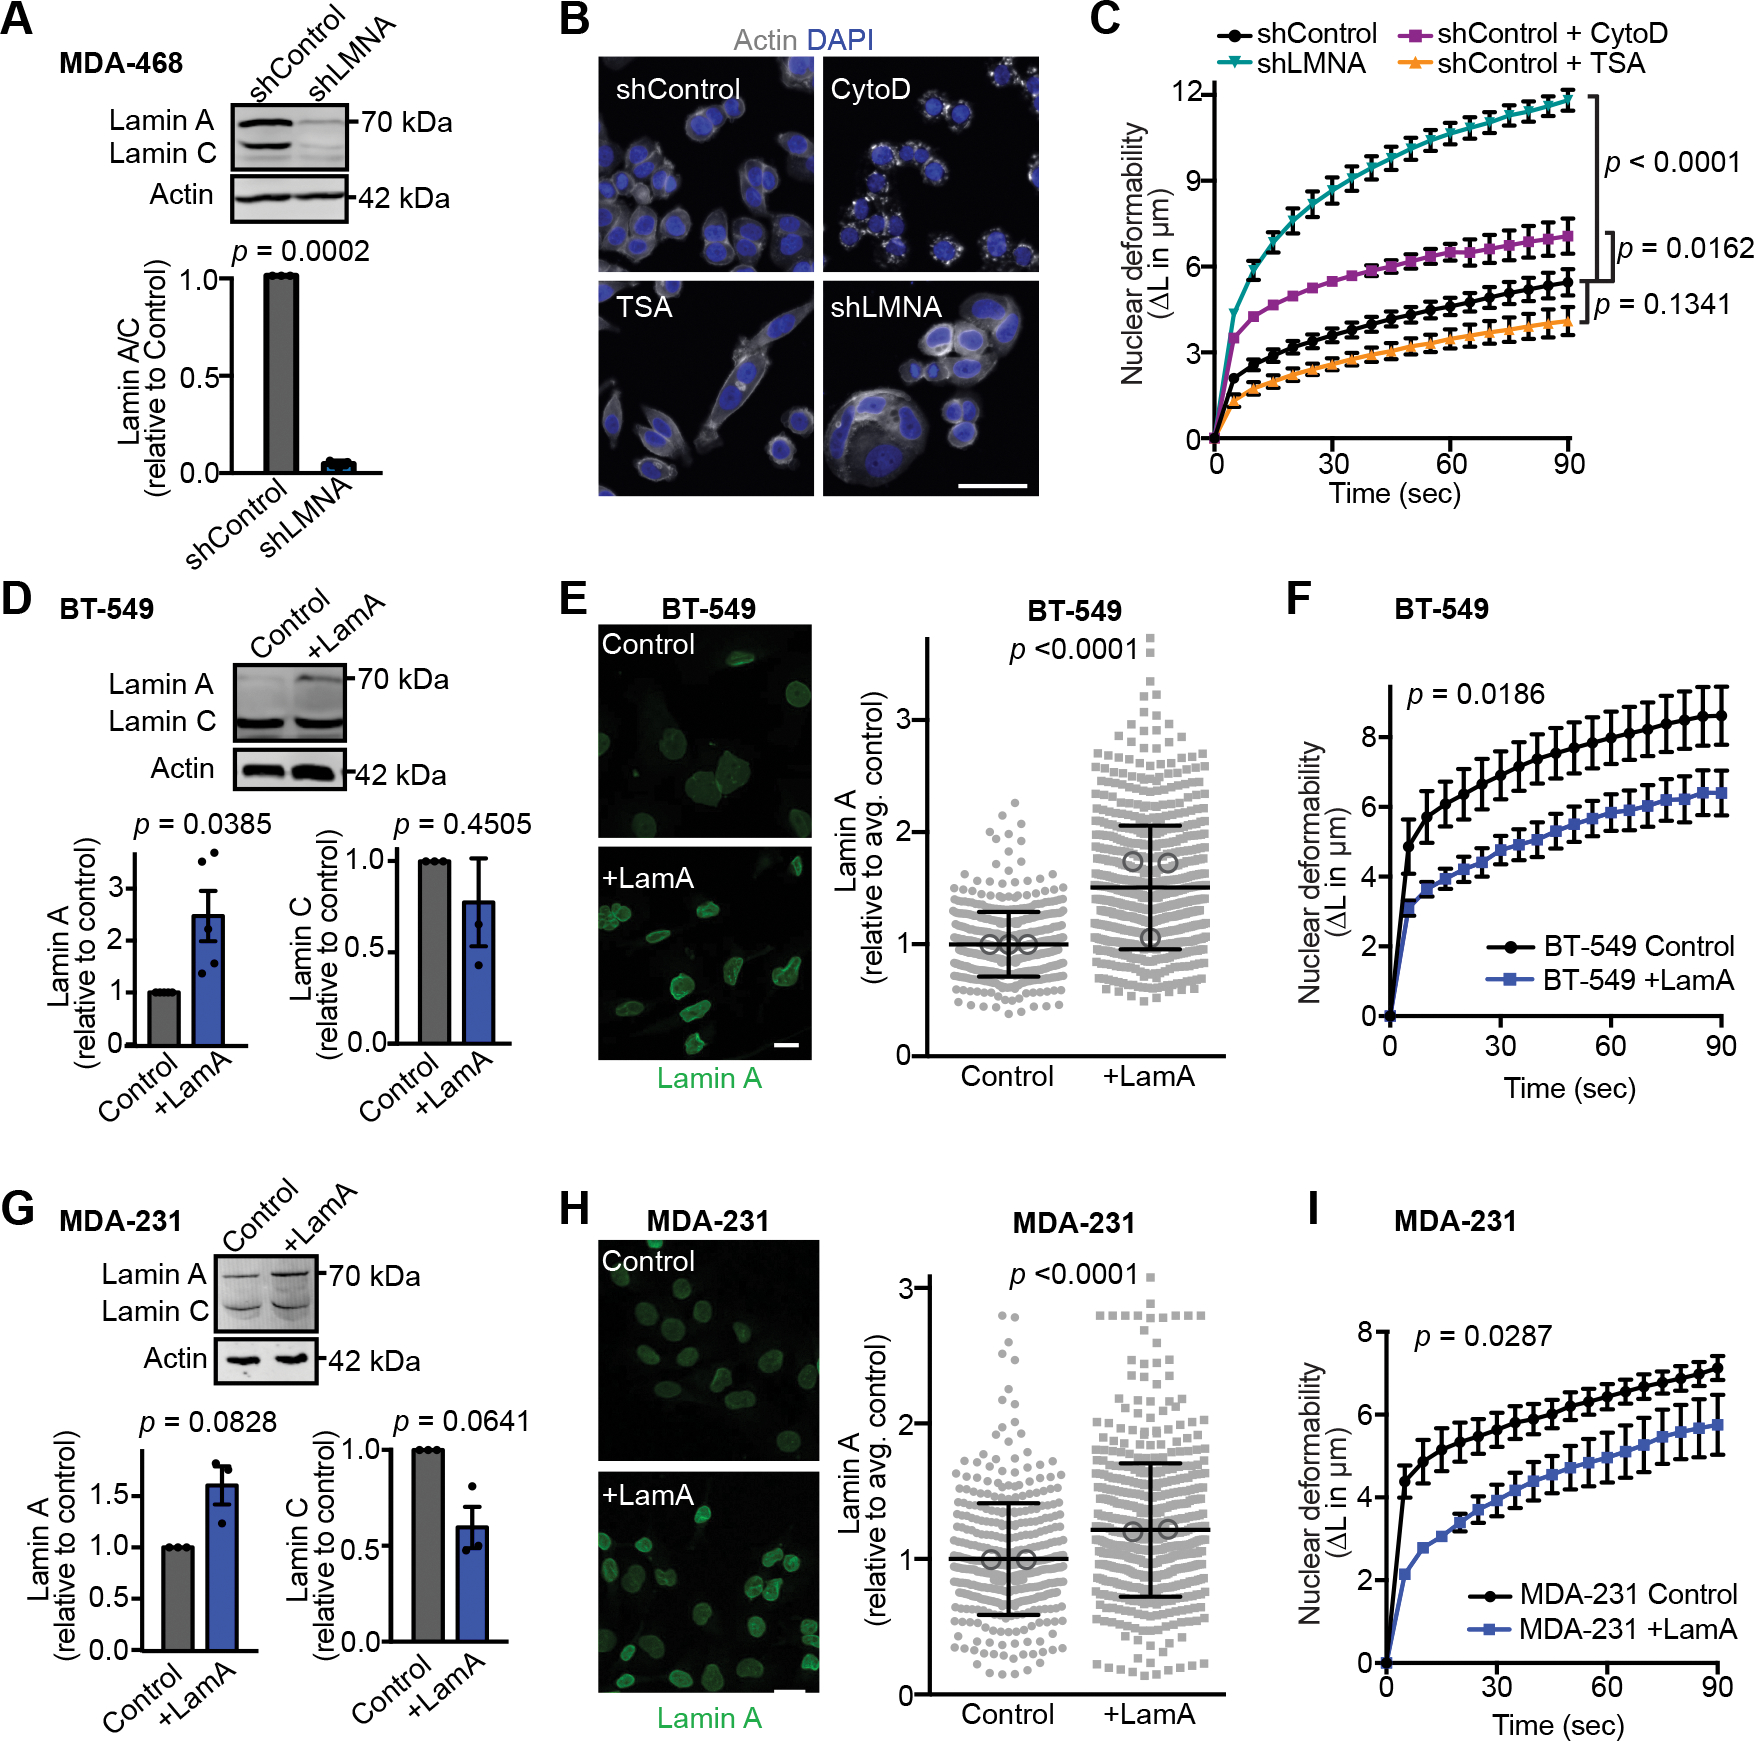
(A) Representative western blot and quantification (N = 3, mean ± SEM) showing decreased lamin A/C levels in MDA-468 cells expressing LMNA shRNA or non-target control. Lamin A/C levels were normalized to non-target control in each Western blot. Significance based on one-sample t test compared to a theoretical value of 1. (B) Representative images of MDA-468 cells stained for DNA (DAPI) and F-actin (phalloidin) to assess the effect of lamin A/C depletion (shLMNA), inhibition of actin polymerization by cytochalasin D (CytoD, 4 μM for 20 minutes), or inhibition of histone deacetylation by trichostatin A (TSA, 4 nM for 12 hours) on cell and nuclear morphology. Scale bar = 20 μm. (C) Micropipette aspiration in a microfluidic device was used to assess which cellular components have the greatest impact on nuclear deformability. MDA-468 shLMNA cells and MDA-468 and non-target controls (shControl) cells treated with CytoD, TSA, or DMSO vehicle control. Statistical analysis based on two-way repeated measures (RM) ANOVA with Tukey’s multiple comparisons test. N = 3 independent experiments with at least 34 individual measurement per condition, per replicate, mean ± SEM. (D) Representative Western blot and corresponding quantification from five independent experiments probed for lamin A/C lamin levels in BT-549 cells with exogenous expression of Lamin A (+LamA) and mock controls. Actin was used as loading control. Statistical analysis based on one-sample t test with a theoretical value of 1 (control). Data shown as mean ± SEM. (E) Examples of immunofluorescence staining of lamins in BT-549 cells expressing exogenous lamin A (+LamA) or control construct and quantification of nuclear rim lamin A staining intensity. Statistics based on two-tailed Mann-Whitney test. Mean ± SD, n = 475 and 661 cells quantified across 3 independent experiments. Means of individual experiments are displayed as open circles. Scale bar = 20 μm. (F) BT-549 cells with addition of lamin A exhibit decreased nuclear deformability as determined by micropipette aspiration in a microfluidic device. Statistical analysis based on two-way RM ANOVA. Data depicted as mean ± SEM for N = 7 independent experiments with at least 6 individual measurement per cell per replicate, for a total of 153 control and 170 +LamA measurements. (G) Representative western blot for lamin A in MDA-231 control and +LamA cells and corresponding quantification based on three independent experiments. Statistical analysis based on one-sample t test with a theoretical value of 1. Data plotted as mean ± SEM. (H) Examples of immunofluorescence staining of lamins in MDA-231 cells expressing exogenous Lamin A (+LamA) or control construct and quantification of nuclear rim lamin staining by immunofluorescence. Statistical analysis based on two-tailed Mann-Whitney test. Mean ± SD, n = 404 and 546 cells quantified across 2 independent experiments. Means of individual experiments are displayed as open circles. Scale bar = 20 μm. (I) MDA-231 cells with addition of lamin A exhibit decreased nuclear deformability as determined by micropipette aspiration in a microfluidic device. Statistical analysis based on two-way RM ANOVA. Data depicted as mean ± SEM for N = 3 independent experiments with at least 5 individual measurement per cell per replicate, for a total of 120 Control and 103 +LamA measurements.