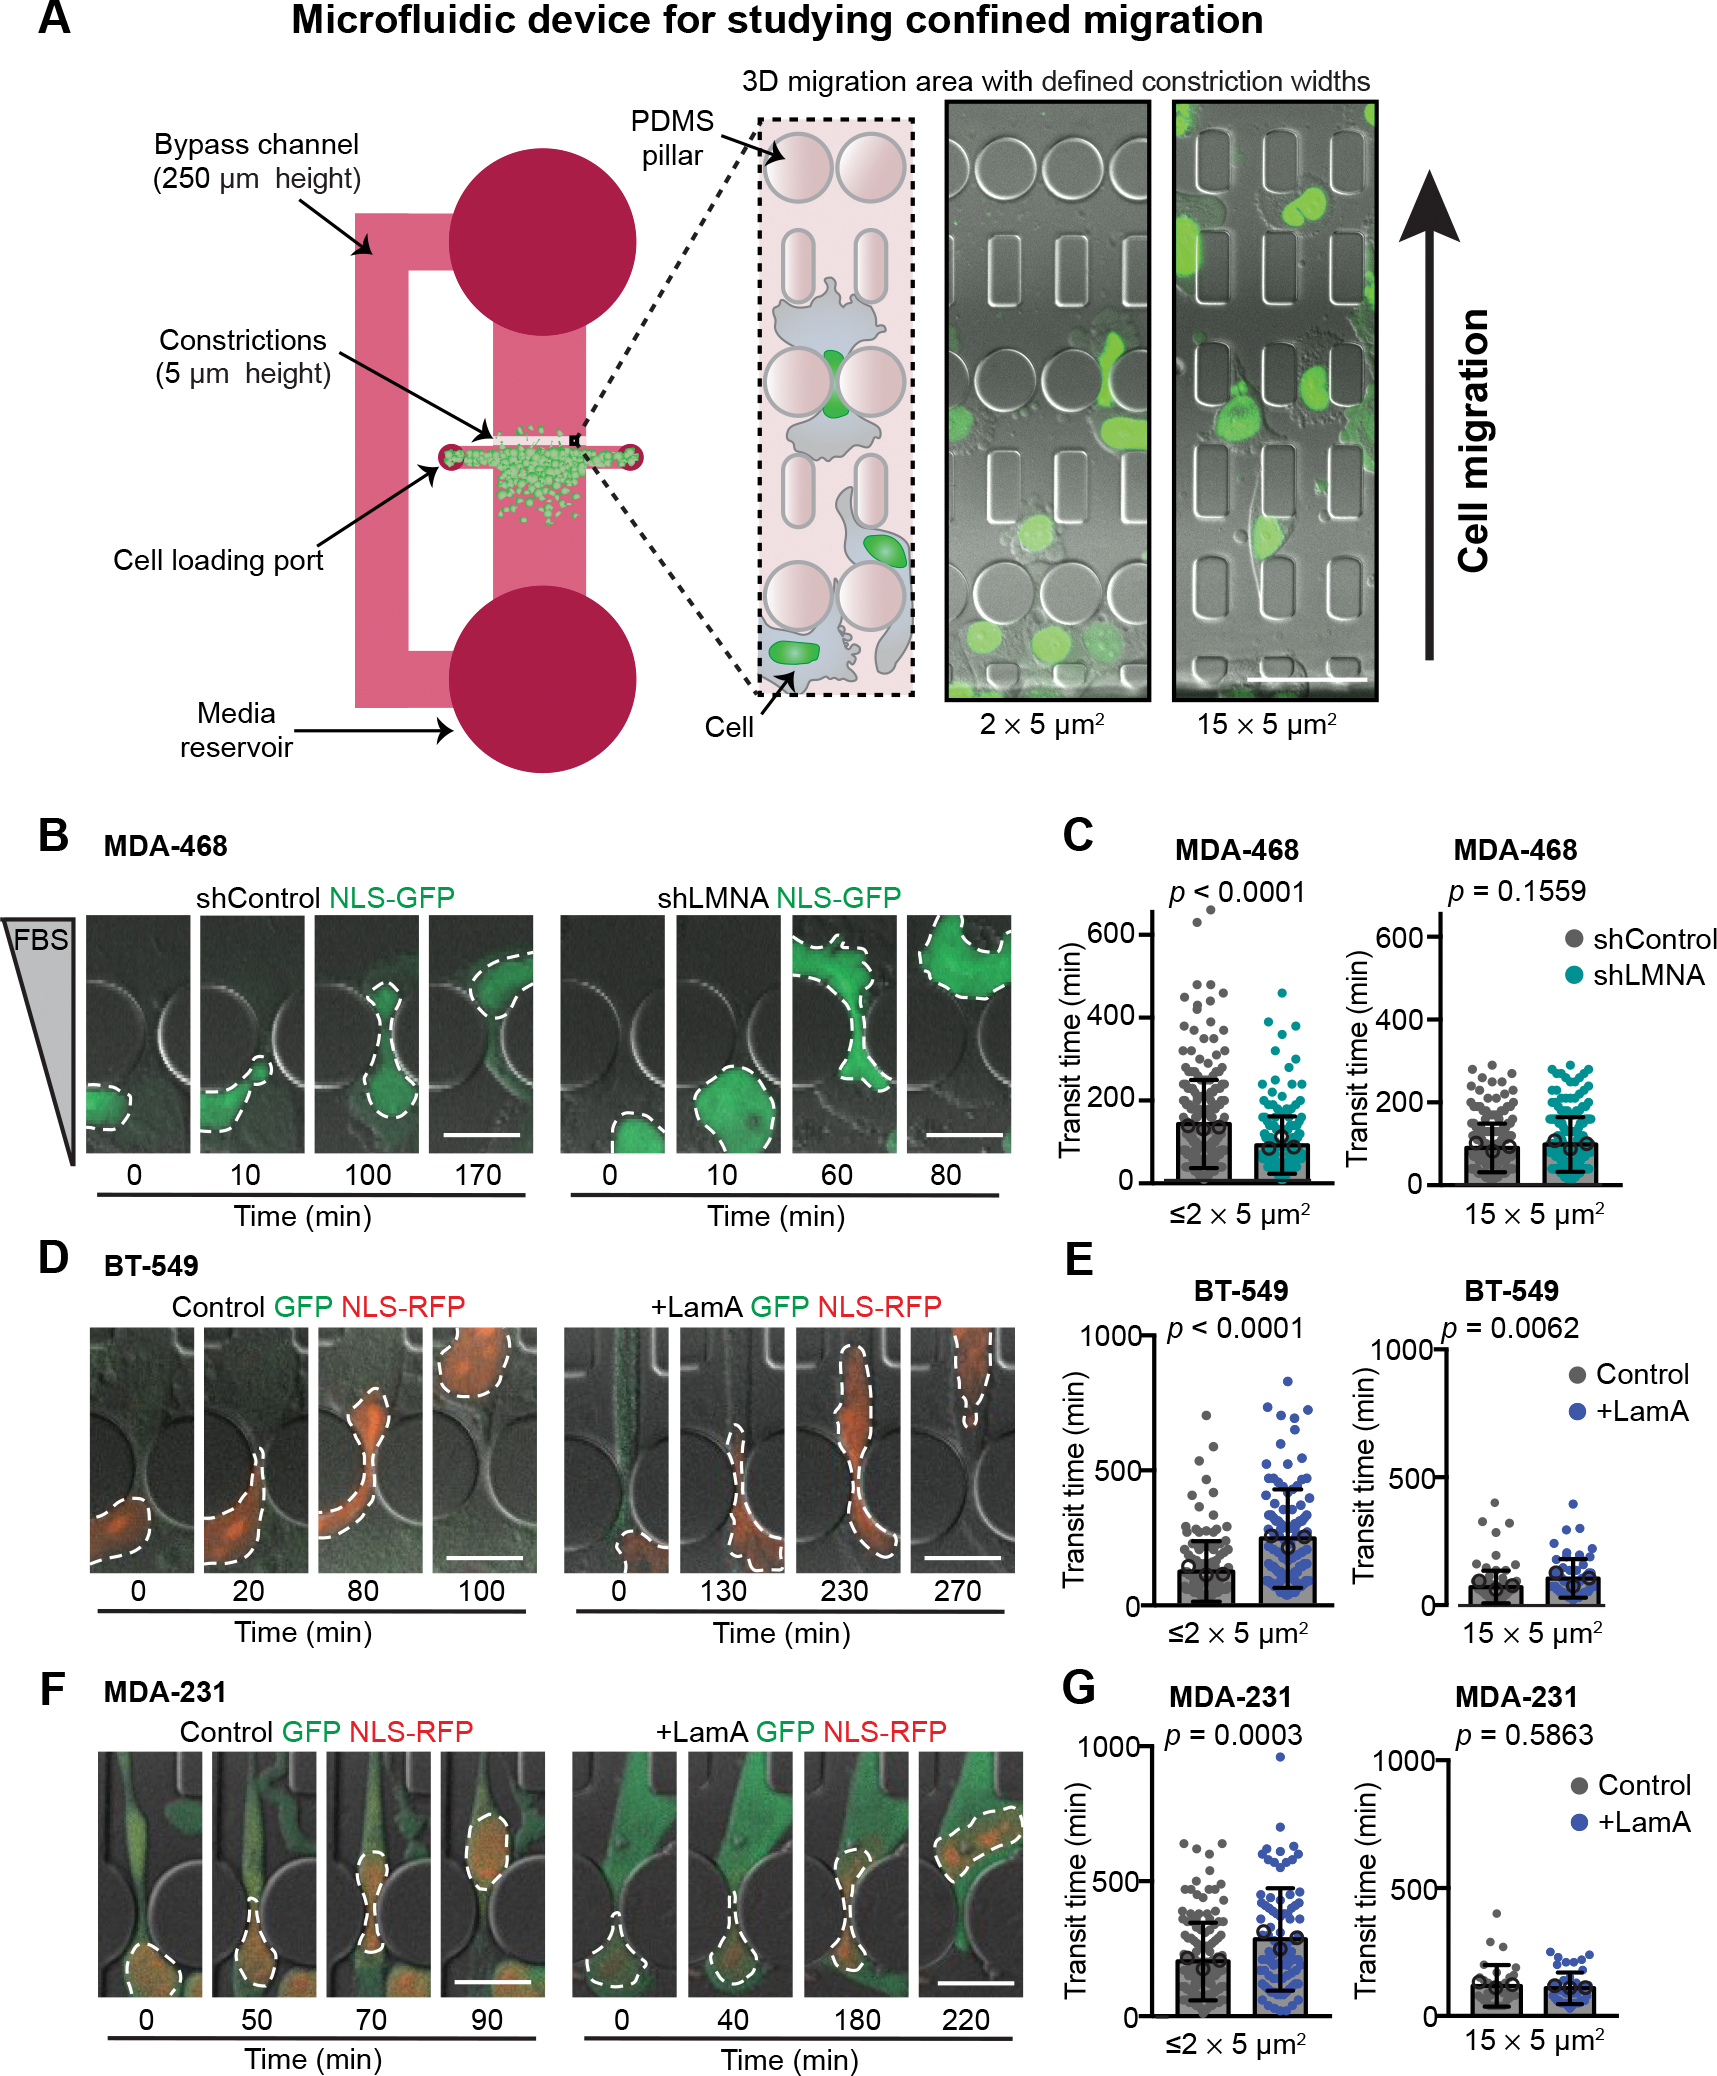
Figure 3. Decreased Lamin A levels facilitate migration through confined spaces.

(A) Schematic of the PDMS microfluidics devices used for analysis of cell migration through confined 3-D environments. Cells are plated into the 250 μm tall space in front of a 5 μm tall migration area containing channels with constrictions that are either 1 × 5 μm2, 2 × 5 μm2, or 15 × 5 μm2 in size. For MDA-468 cells, a chemoattractant of 0.1% to 12% FBS gradient was used to stimulate migration experiments, but a gradient was not needed to stimulate movement of MDA-231 or BT-549 cells. Cells are imaged at 10-minute intervals. Transit times are quantified based on the movement of the fluorescently labeled nucleus through the constrictions. Representative images show NLS-GFP-expressing MDA-468 cells ≈20 hours post-seeding in the device. Scale bar = 50 μm. (B) Representative image sequences of MDA-468 cells expressing shControl and shLMNA as the cells migrate through ≤2 × 5 μm2 constrictions along a 0.1% to 12% FBS gradient. (C) Transit times for MDA-468 shControl and shLMNA cells moving through ≤2 × 5 μm2 (n = 252 and 213 cells) or 15 × 5 μm2 (n = 224 and 206 cells) constrictions along a 0.1% to 12% FBS gradient. (D) Representative image sequences of BT-549 Control and +LamA cells migrating through ≤2 × 5 μm2 constrictions. (E) Transit times for BT-549 Control and +LamA cells moving through ≤2 × 5 μm2 (n = 142 and 108 cells) or 15 × 5 μm2 (n = 71 and 61 cells) constrictions. (F) Image sequences of MDA-231 Control and +LamA cells migrating through ≤2 × 5 μm2 constrictions. (G) Transit times for MDA-231 Control and +LamA cells moving through ≤2 × 5 μm2 (n = 142 and 83 cells) or 15 × 5 μm2 (n = 33 and 42 cells) constrictions. For all cell lines, transit time calculations were collected from across a minimum of three independent experiments and displayed as mean ± SD. Means of individual experiments are displayed as open circles. Statistical analysis based on two-tailed Mann-Whitney test. Scale bars = 20 μm.
