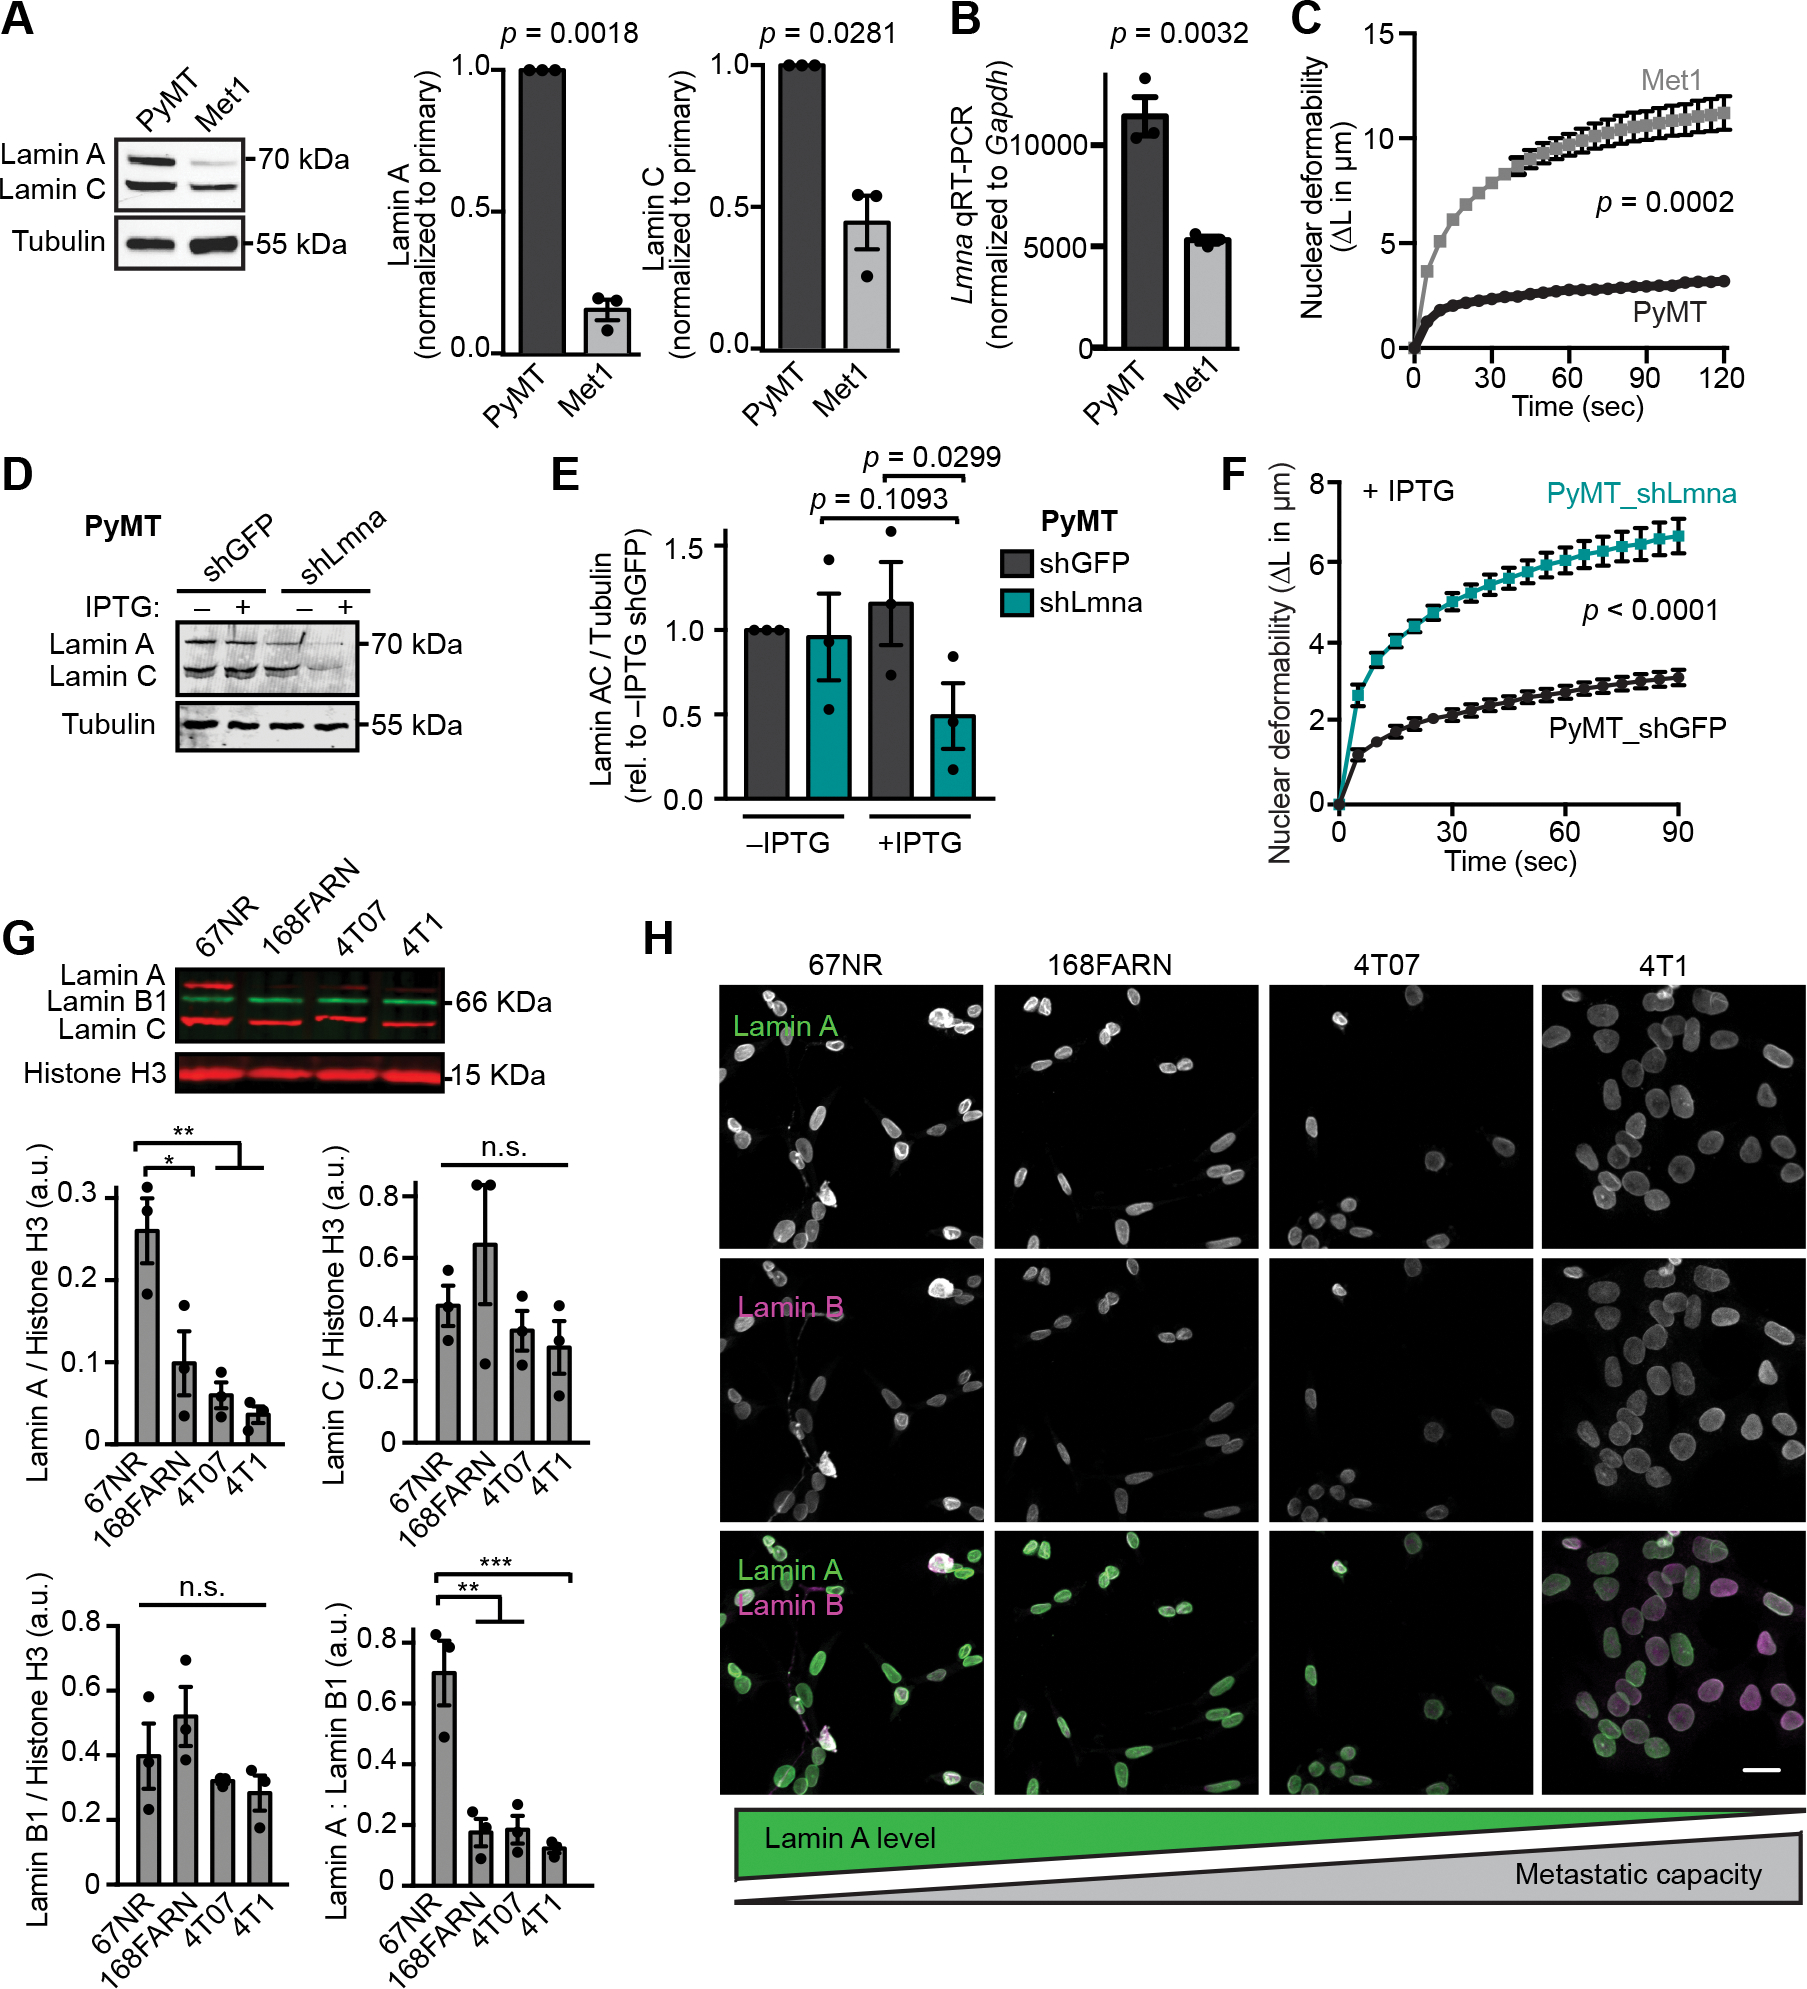
Figure 4. Breast cancer cells with increased metastatic capacity have reduced lamin A expression.

(A) Representative western blot and corresponding quantification (N = 3, mean ± SEM) for lamin A/C levels in MMTV-PyMT transgenic mouse tumor model cell lines from a primary tumor (PyMT) or the highly metastatic Met1 line derived from a late-stage MMTV-PyMT tumor. Tubulin served as a loading control. Statistical analysis based on one-sample t test with a theoretical value of 1. (B) Quantitative RT-PCR for Lmna mRNA in the metastatic Met1 cells compared to the primary tumor PyMT line. Mean ± SEM, N = 3. Statistical analysis by two-tailed unpaired Student’s t test. (C) Nuclear protrusion curves comparing nuclear deformability of Met1 and PyMT cells upon micropipette aspiration in a custom microfluidic device. Mean ± SEM, N = 3, independent experiments with at least 10 individual measurements per cell line, per replicate. Statistical analysis based on two-way RM ANOVA. (D-E) Western blot and corresponding quantification (N = 3, mean ± SEM) of lamin A/C levels in PyMT cells expressing IPTG-inducible shRNA to Lmna or non-targeting (shGFP) control. Cells were cultured in media with or without 0.25 mM IPTG for 48 h prior to analysis. Statistical analysis based on one-way ANOVA with Tukey’s multiple comparisons test. Tubulin was used as a loading control. (F) PyMT cells depleted for A-type lamins as in (D) and (E) exhibit increased nuclear deformability as quantified by micropipette aspiration in a microfluidic device. N = 4 independent experiments with at least 9 individual measurements per cell type, per replicate for a total of 111 shGFP and 142 shLmna measurements. Data depicted as mean ± SEM. Statistical analysis based on two-way RM ANOVA. (G) Representative western blot and corresponding quantification (N = 3, mean ± SEM) of lamin levels in cell lines from the 4T1 mouse mammary tumor metastatic progression series. Histone H3 is included as a loading control. Statistical analysis based on one-way ANOVA with Tukey’s multiple comparisons. *, p = 0.0192, **, p <0.01, ***, p = 0.0008. (H) Representative examples of immunofluorescence staining of lamins in the 4T1 metastatic progression series cell lines. Cell lines are displayed in order of increasing propensity for metastasis during tumor growth in the mouse mammary fat pad. Schematic representation of lamin levels based on the general trend shown in panel D. Scale bar = 20 μm.
