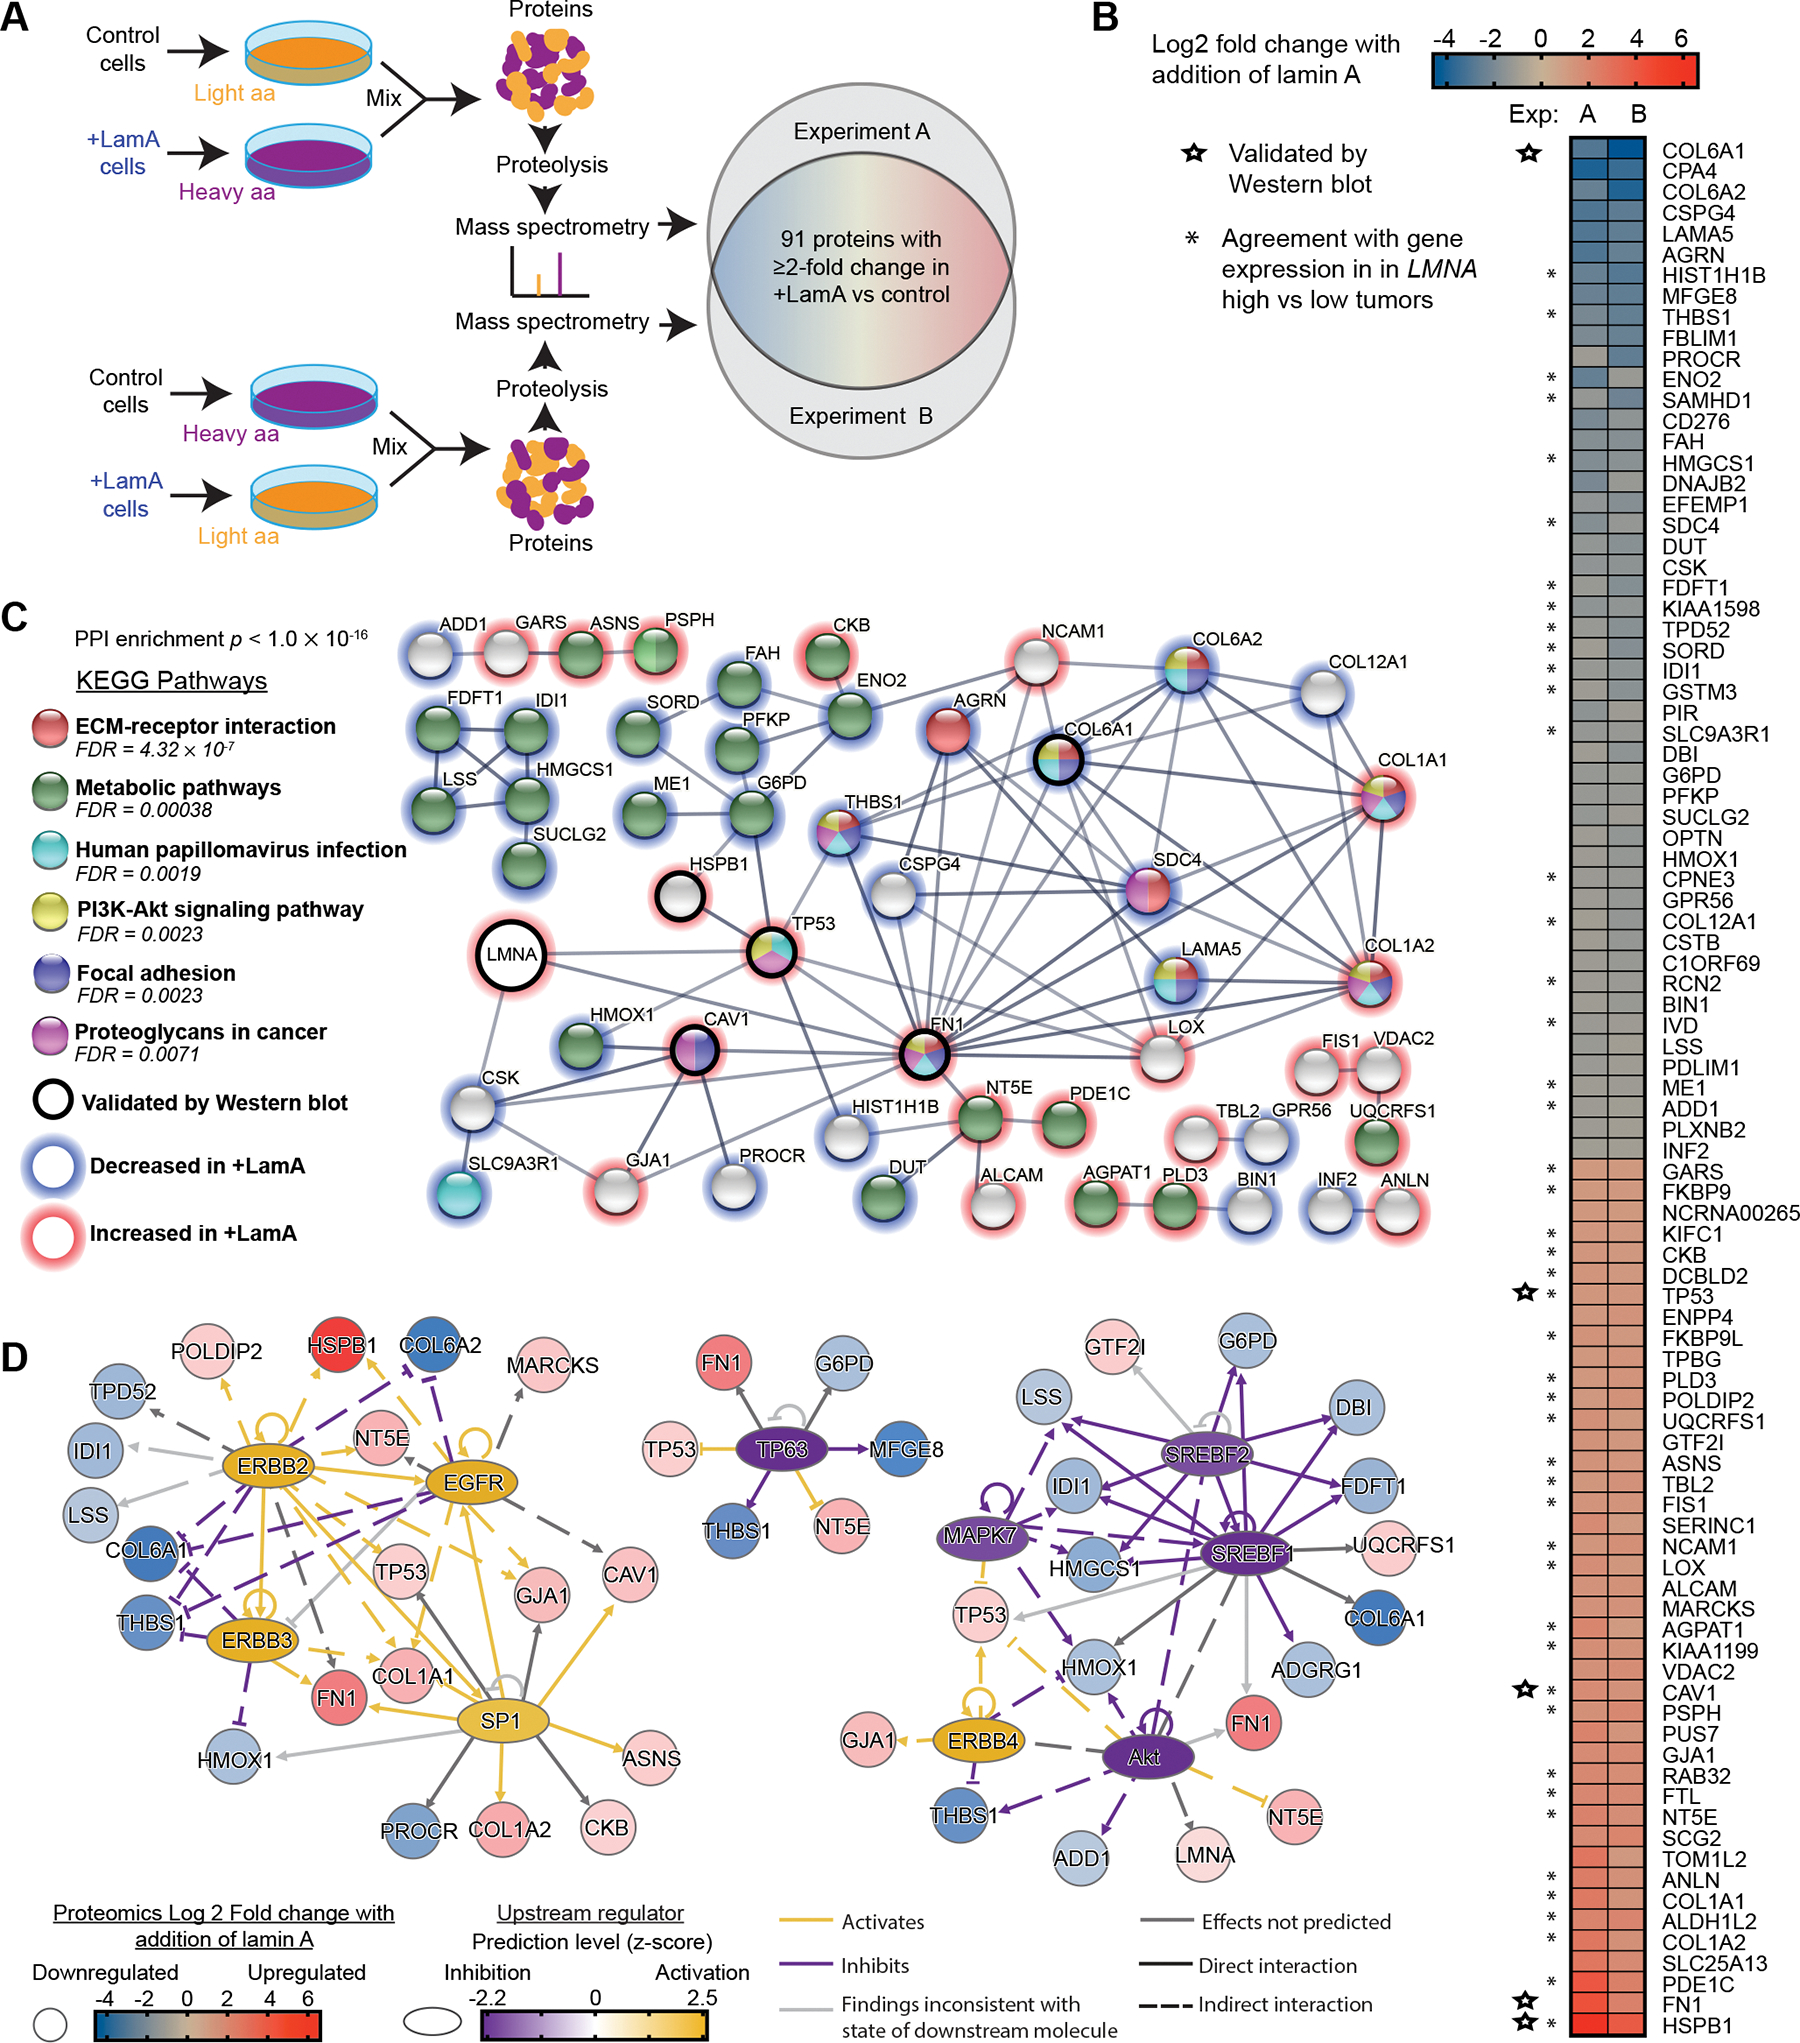
Figure 5. Increasing lamin A in breast cancer cells alters expression of proteins involved in cell metabolism, extracellular remodeling, adhesion, and cytoskeleton dynamics.

(A) Schematic for the design of the SILAC experiments to identify proteins altered upon increased lamin A expression in BT-549 cells. Cells were cultured in media containing normal/light amino acids or heavy amino acids (L-lysine 13C6, 15N2 and L-arginine 13C6, 15N4) for 2 weeks prior to analysis. (B) Proteins listed here were detected to have ≥ 2-fold change in both of two experiments comparing +LamA and control BT-549 cells. Increase (red) and decrease (blue) in protein abundance in +LamA cells relative to controls is indicated by color on a log2 scale. Combined levels of lamin A and C were detected at ≈1.7-fold increase in +LamA cells compared to control cells in both experiments. Stars indicate proteins selected for validation by western blot analysis. Asterisks indicate proteins that exhibit agreement with direction of differential gene expression in “LMNA high” compared to low “LMNA low” breast tumors. High and low groupings were determined as one standard deviation above (≥15.32, n=153) or below (≤13.73, n=145) the mean for normalized LMNA counts, respectively. DESeq2 was performed on these two groups to identify differentially expressed genes (DEGs), which were filtered for adjusted p-value < 0.05. (C) STRING protein association network analysis (confidence threshold >0.6) for the proteins listed in panel B and LMNA. Proteins without any network associations were removed before analysis of KEGG pathway enrichment. Red outlines indicate proteins with increased levels upon lamin A overexpression and blue outlines indicate decreased expression. An additional black outline indicates proteins validated by Western blot. Image adapted from https://string-db.org/. (D) Potential upstream transcriptional regulators were identified in the +LamA SILAC proteomic dataset using QIAGEN Ingenuity Pathway Analysis (IPA) (QIAGEN Inc., https://digitalinsights.qiagen.com/IPA). The Upstream Regulator Analysis module was used to identify potential transcriptional regulators. An activation z-score >1.5 and <−1.5 and Benjamini-Hochberg corrected p-value <0.05 were used to identify significant upstream regulators. Blue to red coloration indicates decreased or increased protein levels in +LamA relative to control BT-549 cells, and purple to yellow coloration indicates predicted inhibition or activation of potential upstream regulators.
