
Figure 6. Lamin A levels modulate breast cancer cell morphology and proliferation.
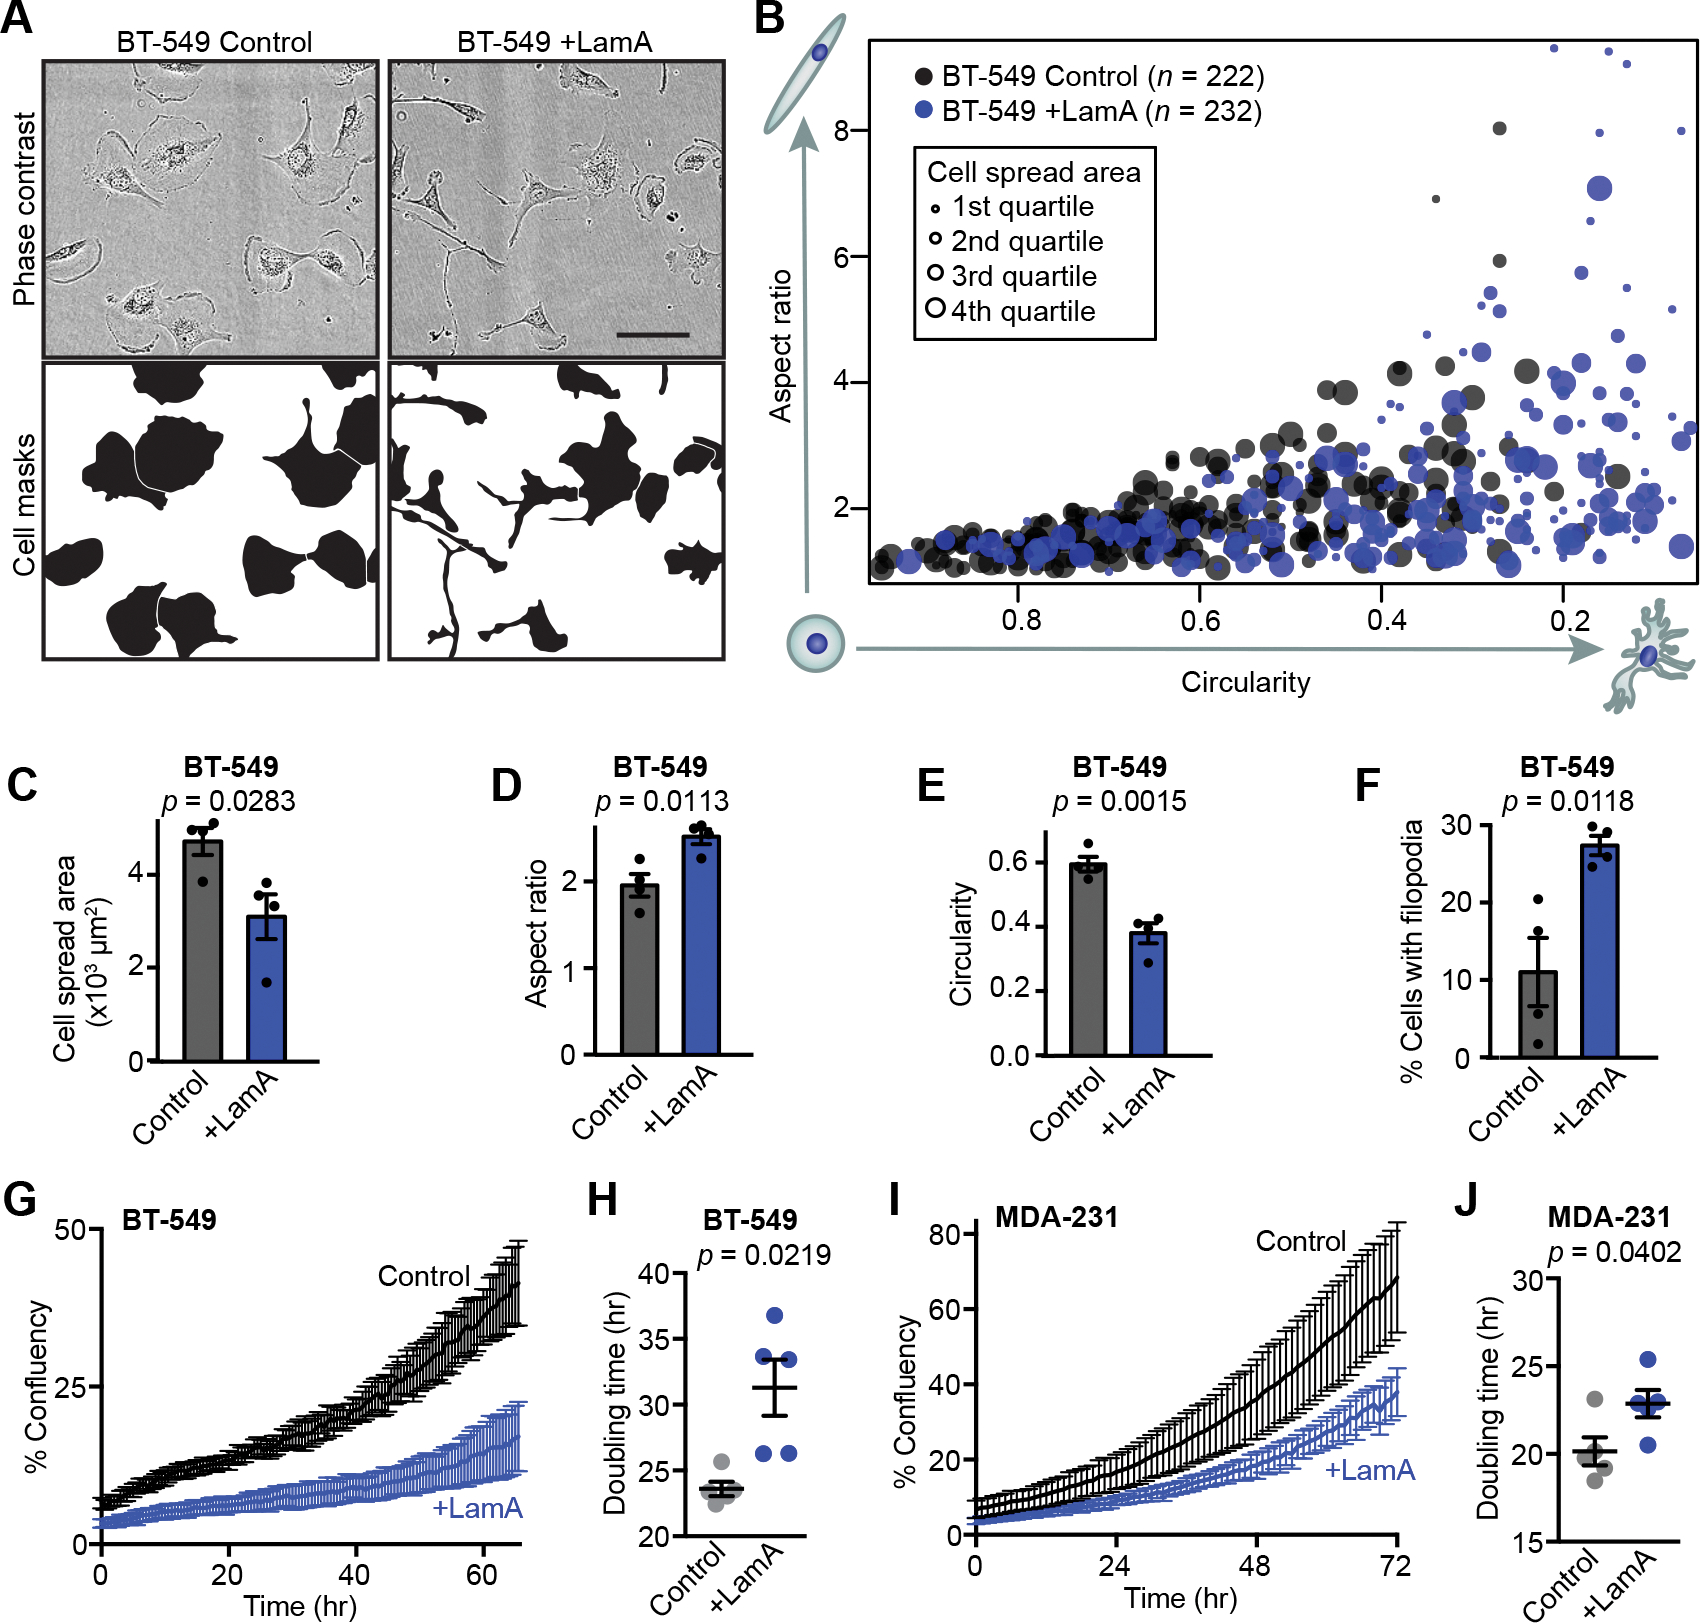
(A) Representative images showing morphology of BT-549 control and +LamA cells. Scale bar = 100 μm. (B) Quantification of cell morphology (circularity, aspect ratio and cell spread area) for BT-549 control and +LamA cells. Larger marker size indicates larger cell spread area. Data shown were collected across 4 independent experiments. (C-F) Adherent BT-549 control and +Lam A cells were quantified (N = 4, mean ± SEM) to determine cell spread area (C), cell aspect ratio (D), cell circularity (E), and the percentage of cells exhibiting filopodia-like protrusions (F). Statistical analysis by two-tailed unpaired Student’s t test. (G) Representative proliferation curves for BT-549 control and +LamA cells. Data shown represent a single experimental replicate where measurements were collected from images taken every 0.5 hour from 7 wells per condition plotted as mean ± SD. (H) Doubling times were calculated for BT-549 control and +LamA cells from N = 5 independent experiments. Data plotted as mean ± SEM and statistical analysis by two-tailed unpaired Student’s t test with Welch’s correction for unequal variances (I) Representative proliferation curves for MDA-231 control and +LamA cells. Data shown represent a single experimental replicate where measurements were collected from images taken every 0.5 hour from 7 wells per condition plotted as mean ± SD. (J) Doubling times were calculated for MDA-231 control and +LamA cells from N = 5 independent experiments. Data plotted as mean ± SEM and statistical analysis by two-tailed unpaired Student’s t test.