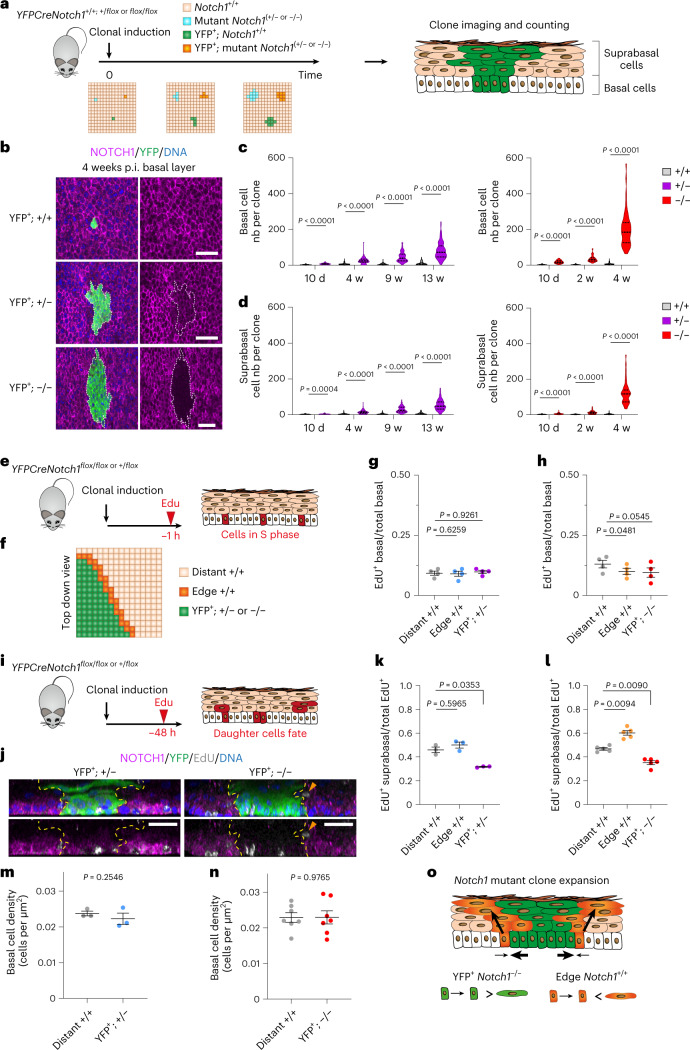
Fig. 2. Lineage tracing of Notch1 mutant clones.
a, Protocol. YFPCreNotch1+/+, YFPCreNotch1+/flox and YFPCreNotch1flox/flox mice were induced at clonal density. YFP+ Notch1 wild type (+/+) and YFP+ Notch1 mutant clones (+/− or −/−) were imaged at several time points. b, xy plane basal layer view at 4 weeks p.i. of wild type, Notch1+/− and Notch1−/− clones stained for NOTCH1, magenta, YFP, green and DNA, blue. White dashed lines delineate mutant clones. Scale bars: 30 µm. c,d, Basal (c) and suprabasal (d) cells per clone following induction of Notch1+/− (left panel) or Notch1−/− (right panel) compared to Notch1+/+ clones. Lines show median and quartiles. n mice (clones) for +/+ at 10 d, 2 weeks, 4 weeks, 9 weeks and 13 weeks, respectively: 3 (206)/ 3 (155)/ 3 (143)/ 3 (132)/ 3 (126). n mice (clones) for +/− at 10 d, 4 weeks, 9 weeks and 13 weeks, respectively: 5 (84)/4 (97)/4 (68)/7 (107). n mice (clones) for −/− at 10 d, 2 weeks, 4 weeks, respectively: 6 (68)/ 3 (69)/ 9 (63). Two-tailed Mann–Whitney test of mutant against +/+ at each time point. e, Protocol. YFPCreNotch1+/flox and flox/flox mice were clonally induced, and S phase cells labeled with EdU, 1 h precollection (red). f, EdU+ cells were counted inside clones (green), in wild-type cells adjacent to clones (orange) or distant from clones (beige). g,h, Ratio of EdU+: total basal cells in YFP+ Notch1+/− (g) or Notch1−/− (h) mutant clones (YFP+; +/− or −/−), in wild type cells at clone edges (edge +/+) or distant from clones (distant +/+). (Mean ± s.e.m., each dot represents a mouse; g, n = 4830; 1584; 4607 cells in distant +/+; edge +/+; YFP+ +/− clones from four mice; h, n = 3967; 1036; 4279 cells in distant +/+; edge +/+; YFP+ −/− clones from four mice). One-way RM ANOVA; adjusted P values from Tukey’s multiple comparisons test against distant+/+. i, Protocol. Mice were clonally induced and EdU injected 48 h before collection. Labeled cells, red, reveal division outcomes. j, Z plane (side) views of projected confocal z stacks of YFP+ Notch1+/− clone 13 weeks p.i. (left), and YFP+ Notch1−/− clone 4 weeks (p.i. right) from (i). NOTCH1 (magenta); YFP (green); EdU (gray); DNA (blue). Yellow dashed lines show clone edges. Orange arrow shows differentiating cell adjacent to clone. Images representative of clones in 3 YFPCreNotch1+/flox and 5 YFPCreNotch1flox/flox mice. Scale bars: 30 µm. k,l, Protocol as in i. EdU+ suprabasal/total EdU+ cells in YFP+ Notch1+/− (k), YFP+ Notch1−/− (l) mutant clones (YFP+; +/− or −/−), in wild type cells at clone edges (edge +/+) or distant from (distant +/+) clones. (Mean ± s.e.m., each dot represents a mouse; k, n = 471; 300; 525 EdU+ cells in distant +/+; edge +/+; YFP+ +/− clones from three mice; l, n = 1304; 723; 1318 EdU+ cells in distant +/+; edge +/+; YFP+ −/− clones from five mice). One-way RM ANOVA; adjusted P values, Tukey’s multiple comparisons test against distant+/+. m,n, Basal cell density in mutant clones (+/− in m, −/− in n) and in respective distant wild-type areas (distant +/+). (Mean ± s.e.m., each dot represents a mouse. n = 3 mice in m, n = 6 mice in n). Two-tailed paired Student’s t-tests. o, Mechanism of Notch1 mutant clone expansion. Mutant cell divisions produce more progenitors than differentiating cells on average. Neighboring wild-type cells stratify at the edge of Notch1−/− mutant clones, allowing accelerated mutant clone expansion. P.i., postinduction. Nb, number. RM, repeated measures; w, weeks. See Supplementary Tables 7 and 8.

