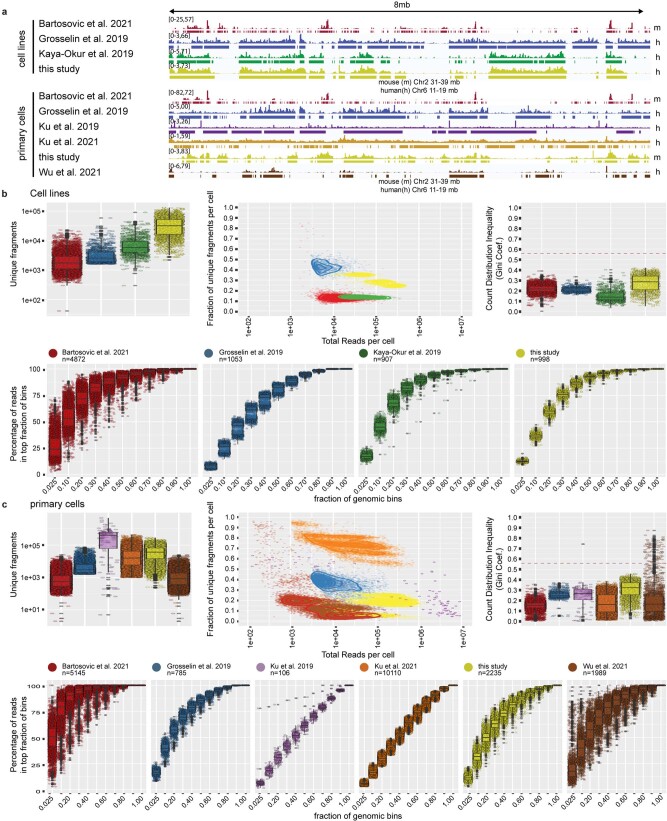
Extended Data Fig. 2. Comparison with existing single cell chromatin profiling methods.
(a) genomic tracks of pseudobulk data of either cell lines (top) or primary cells (bottom). Tracks labeled on the right with h show 8 mb of the human chromosome 6 (Chr6:11–19 mb). Tracks labeled with m show 8 mb of the mouse chromosome 2 (Chr2: 31–39 mb). Lines underneath each track indicate peak calling results. (b, c) Comparison across studies of unique fragments per cell, fraction of unique reads vs mapped reads, Gini coefficient, and cumulative distribution of signal over the genome. The spread of data points per genomic fraction reflects agreement between single cells, the elbow-point indicates the fraction of the genome covered by the histone mark. (b) cell lines. (c) primary cells. Boxplots show 25th percentile, median and 75th percentile, with the whiskers spanning 97% of the data. Red line in Gini plots indicates coefficient determined from public bulk chip sample (ENCSR000EWB).

