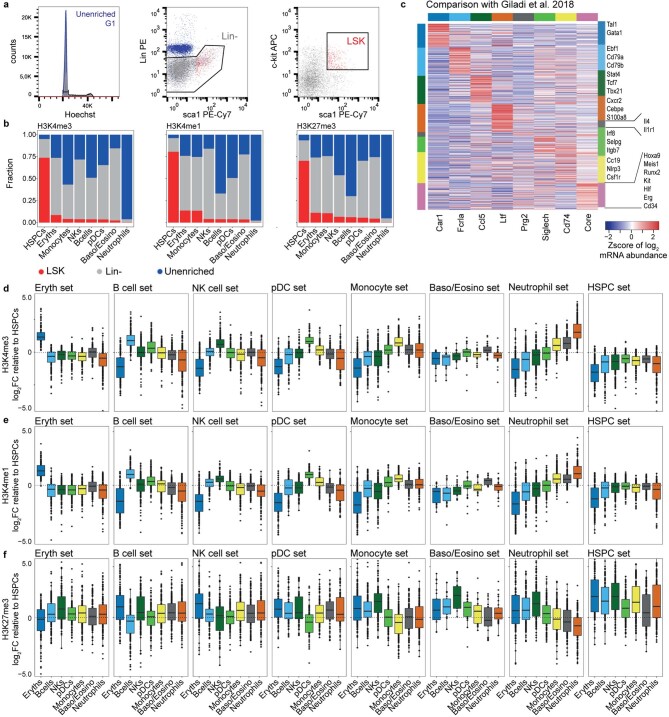
Extended Data Fig. 3. H3K4me1 and H3K4me3 in HSPCs prime for different blood cell fates, while H3K27me3 in differentiated cell types silences genes of alternative cell fates.
(a) FACS plot for sorting G1 cells of whole bone marrow (unenriched), lineage negative (Lin−), and Lin−,Sca1+, cKit+ (LSK) populations. (b) Fraction of cells in each cell type labeled by the sorted population: whole bone marrow (unenriched), lineage negative (Lin−), and Lin-Sca1+cKit+ (LSK). (c) Cell type-specific mRNA abundances for genes associated with regions in Fig. 2E using pseudobulk analysis of the Giladi et al. 2018 dataset (Methods). (d) H3K4me3 fold changes of different cell types relative to HSPCs at cell type-specific regions. Each panel corresponds to a set of cell type-specific regions defined by the rows of one color in the heatmap of Fig. 2e. Regions are defined by +/− 5 kilobase windows centered at transcription start sites of cell type-specific genes. (e) Same as (d) but for H3K4me1. (f) Same as (d) but for H3K27me3. Boxplots show 25th percentile, median and 75th percentile, with the whiskers spanning 97% of the data. For DCs and Baso/Eosino sets, each boxplot contains n = 91 and n = 25 regions, respectively. For all other sets, each boxplot contains n = 150 regions.

