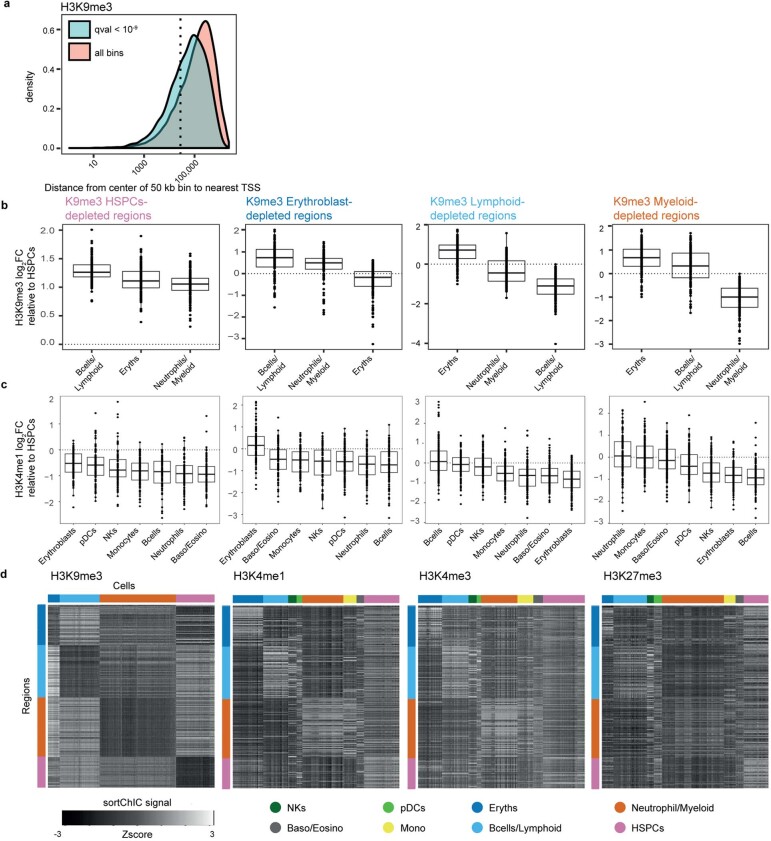
Extended Data Fig. 4. Lineage-specific loss of H3K9me3 correlates with cell type-specific increase in H3K4me1.
(a) Statistically significant 50 kb regions (adjusted p-value < 109, deviance goodness-of-fit test) identified for H3K9me3, showing distribution of distances from center of 50 kb region to nearest TSS of a gene. All bins are identified as 50 kb regions that have pseudobulk (counts summed across all cells) signal above background levels (Methods). Dotted line represents 25 kb, meaning the bin would overlap with a TSS. (b) Fold change in H3K9me3 relative to HSPCs for four sets of 150 regions: regions depleted in erythroblasts, lymphoid, myeloid, or HSPCs. Each region is 50 kb wide. Each boxplot contains n = 150 regions. (c) The same four sets of regions but showing fold change in H3K4me1, showing upregulation of H3K4me1 specifically in cell types that are depleted in H3K9me3. Each boxplot contains n = 150 regions. Boxplots show 25th percentile, median and 75th percentile, with the whiskers spanning 97% of the data. (d) Heatmap of the four regions in single cells across the four marks. Rows are regions, color coded as in top of (b). Columns are cells, color coded as shown below.

