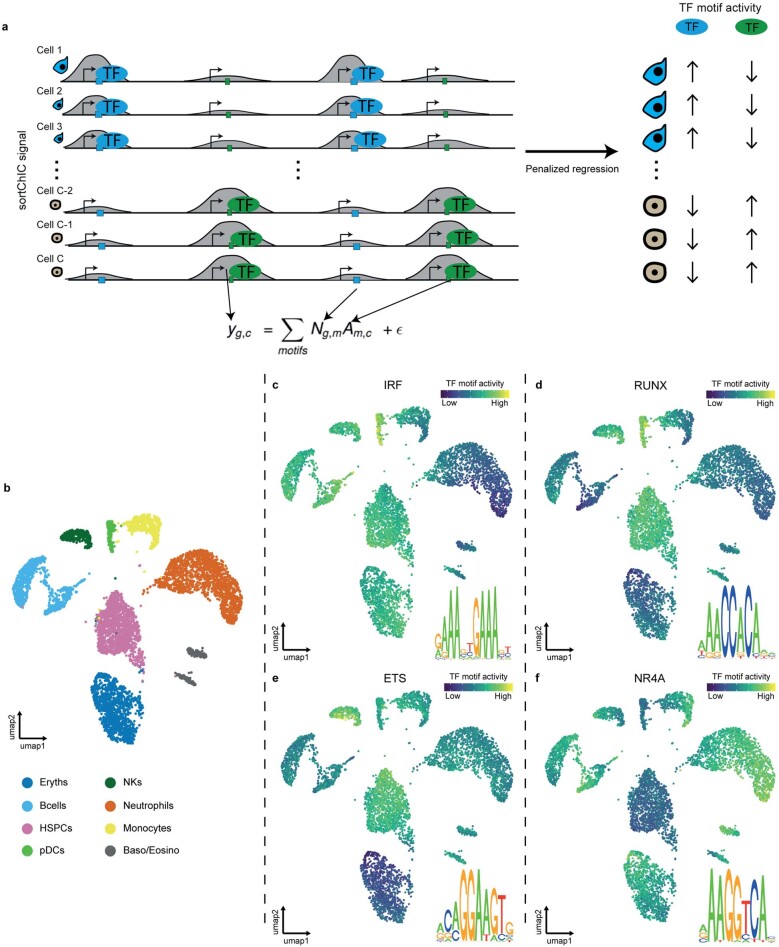
Extended Data Fig. 6. Penalized regression model reveals transcription factor motifs underlying cell type-specific chromatin dynamics.
(a) Schematic of the transcription factor (TF) activity model. The penalized regression model takes the imputed sortChIC signal in a peak as the response variable and the TF binding motifs predicted under each peak as the explanatory variable (Method). The penalized multivariate regression infers the TF motif activity driving cell type-specific sortChIC signal. (b) UMAP of H3K4me1 chromatin states in single cells, colored by cell type. (c–f) UMAP where each cell is colored by the TF activity inferred from the model. Four cell type-specific TF motifs are shown.

