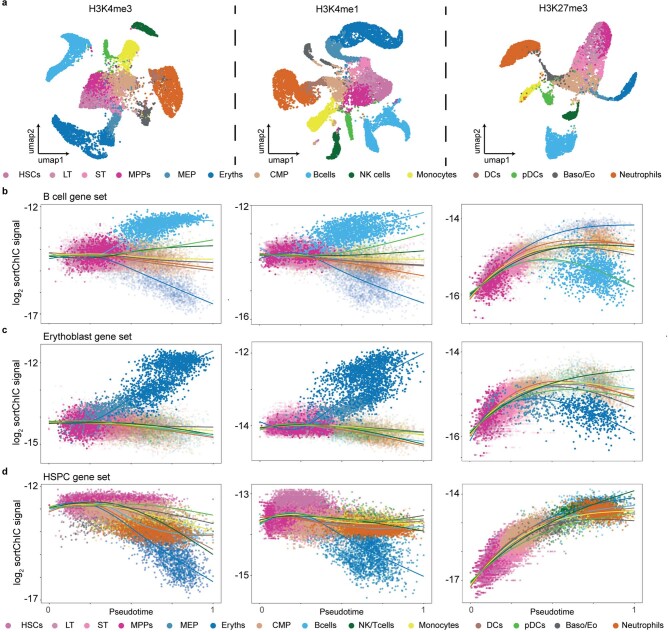
Extended Data Fig. 10. Pseudotime analysis from HSCs to mature cell types at TSS of cell-type specific genes.
(a) UMAP for H3K4me3 (n = 12085), H3K4me1 (n = 10952) and H3K27me3 (n = 7984). (b) H3K4me3, H3K4me1, and H3K27me3 mean sortChIC signal across B cell-specific marker genes (the same 150 marker genes defined from heatmap from Fig. 2e). (c) Same as (b) but for erythroblast marker genes. (d) Same as (b) but for HSPC marker genes.

