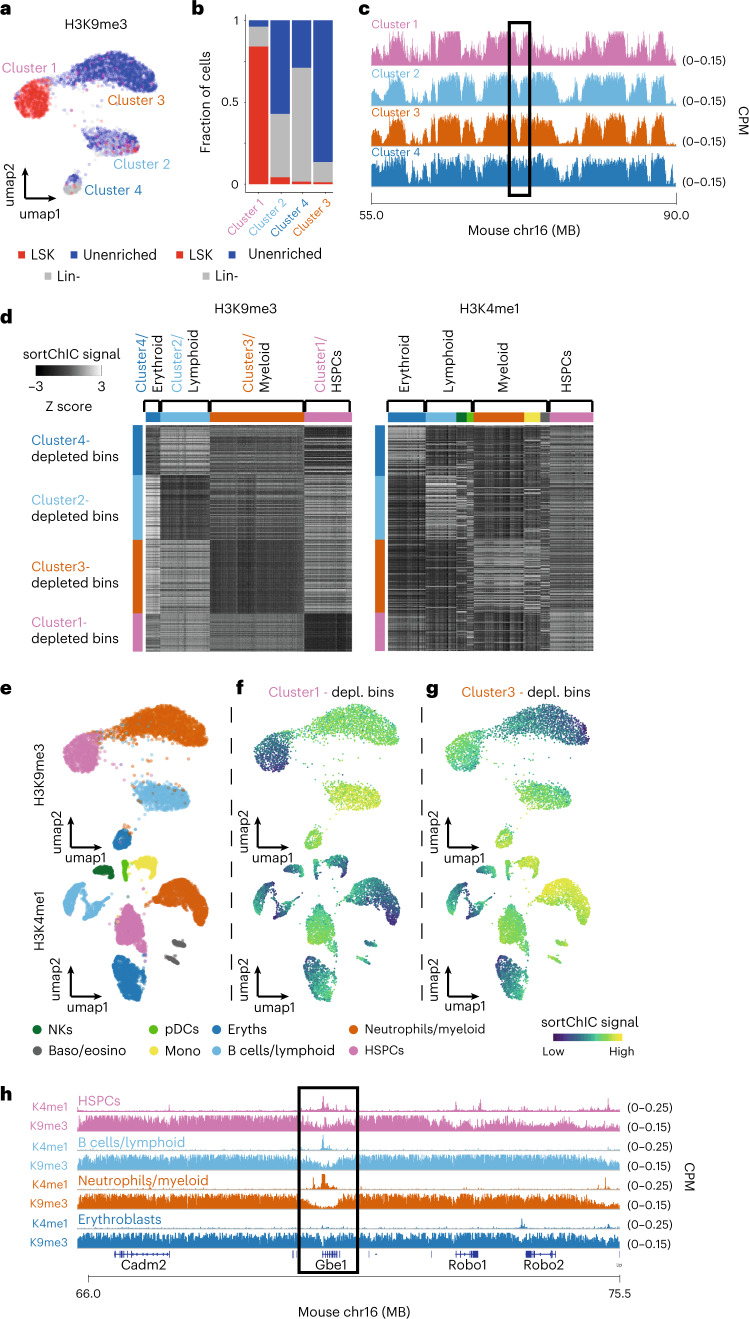
Fig. 3. Heterochromatin state dynamics during hematopoiesis.
a, UMAP of H3K9me3 (n = 3,631) representing single cells from whole BM (unenriched), Lin− and LSK sorted cells. b, Fraction of unenriched, Lin− and LSK cells in each of the four H3K9me3 clusters. c, Region showing the H3K9me3 pseudobulk sortChIC signal of the four clusters. d, Heatmap of 50 kb bins displaying the relative H3K9me3 (left) and H3K4me1 (right) sortChiC signal in erythroblasts, lymphoid, myeloid and HSPCs. e, UMAP of H3K9me3 and H3K4me1 sortChIC data, colored by cell type. f, Single-cell signal of cluster1-depleted bins (averaged across the 150 bins) showing low H3K9me3 and high H3K4me1 signal in lymphoid cells. Same bin set was used for both histone modifications. g, Single-cell signal of cluster3-specific bins showing low H3K9me3 and high H3K4me1 signal in myeloid cells. h, Zoom-in of the same genomic region in c for H3K9me3 and H3K4me1 pseudobulk sortChIC signal.

