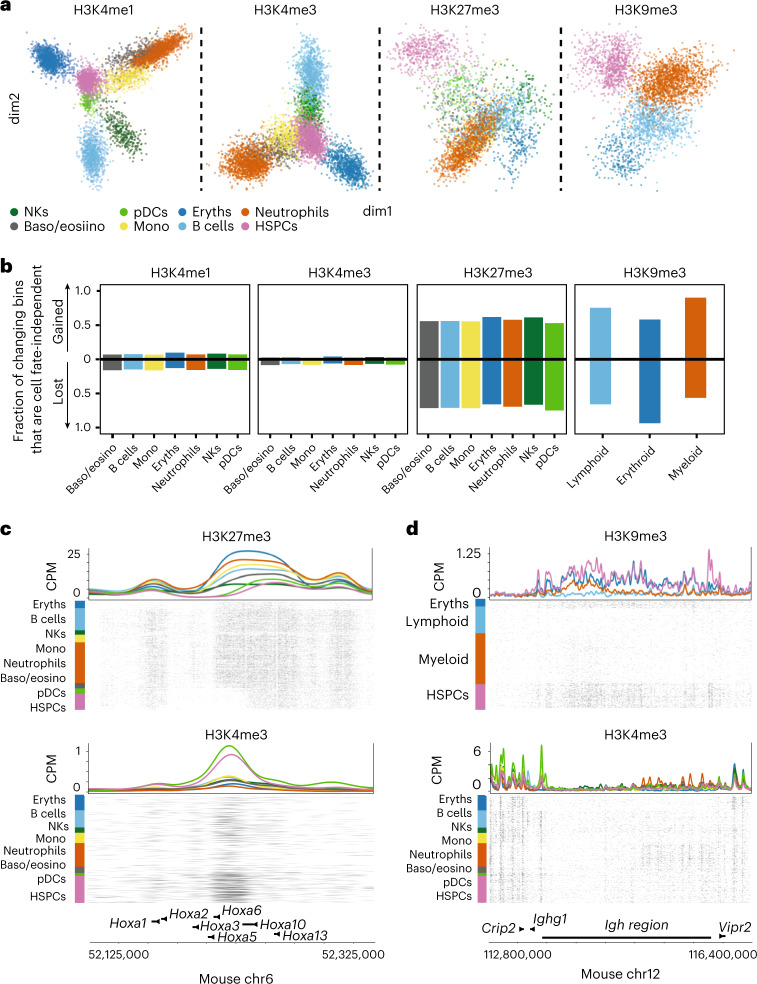
Fig. 4. Repressive chromatin dynamics are largely cell fate-independent.
a, Dimensionality reduction from GLMPCA (Methods) showing the two main latent factors explaining the sortChIC data for each mark. b, Barplot of the fraction of changing bins (Methods) that are gained or lost in all non-HSPCs relative to HSPCs. Each cell type shows two bars, one for each direction (either gained or lost). Fraction is calculated by dividing the number of bins that change cell fate independently by the number of bins that change in that cell type for that direction. c, Genome browser view of the Hoxa region showing an H3K27me3 domain that is gained during hematopoiesis. Top shows H3K27me3 and the bottom H3K4me3. d, Genome view of the Igh region displaying the loss of an H3K9me3 domain in lymphoid and myeloid cells. Top shows H3K9me3 and the bottom H3K4me3.

