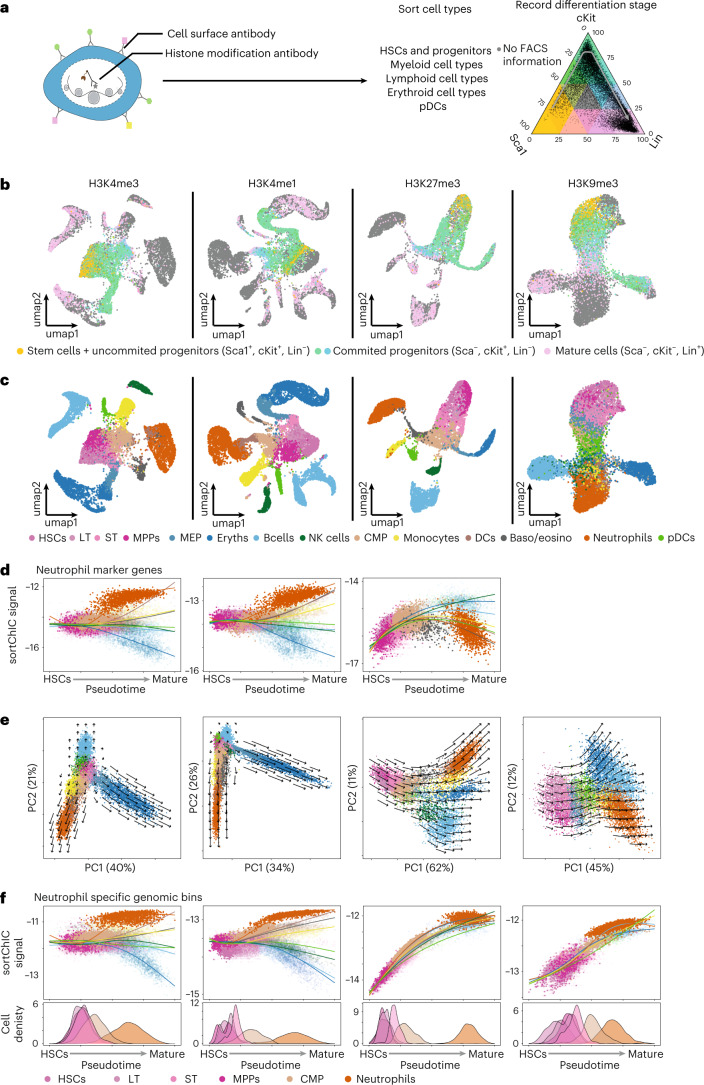
Fig. 7. Trajectory analysis across stem, progenitor and mature cell types reveal histone mark-specific chromatin velocities.
a, sortChIC design to capture stem, progenitor and mature cell types during hematopoiesis. Ternary plot of cells for Sca1, cKit and Lin marker levels measured by FACS. b, Sca1, cKit and Lin-stained cells plotted in UMAP space. Cells with staining are colored according to their relative levels of Sca1, cKit and Lin, as coded in a. Cells unstained for these surface molecules are colored gray. c, UMAP integrating all BM sortChIC data for each of the four histone modifications. Cell type identity is based on the sorted cell types explained in Extended Fig. 8a (number of cells for H3K4me3, n = 10,952; H3K4me1, n = 12,085; H3K27me3, n = 7,934 and H3K9me3, n = 8,886). d, Mean sortChIC signal of neutrophil marker genes (defined from heatmap Fig. 2e). The same 150 regions are used for each histone modification. e, First two principal components for the sortChIC data. Chromatin velocities are calculated for each bin and then projected onto the PCA for each modification separately (Methods). f, Mean sortChIC signal for bins that are upregulated in neutrophils relative to HSPCs across cell types for the four histone marks independently. Regions are defined for each histone modification separately (H3K4me3, 1,009 bins; H3K4me1, 4,473 bins; H3K27me3, 2,549 bins and H3K9me3, 2,838 bins). Density plots below show the distribution of cell types along the neutrophil trajectory (HSCs, LTs, STs, MPPs, CMPs and neutrophils).

