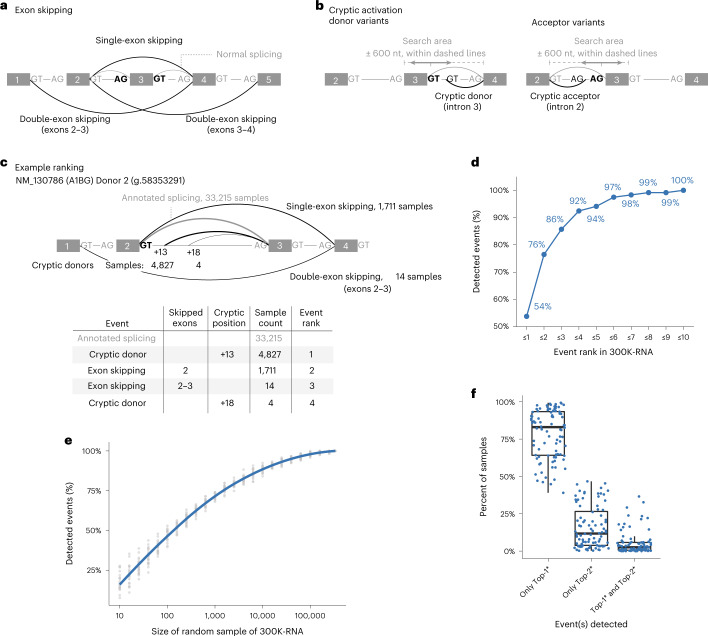
Fig. 2. Unannotated splicing events seen in 300K-RNA.
a, Exon-skipping events are evidenced by split-reads spanning nonconsecutive exons within the transcript. Splice sites (GT/AG motifs) shown in bold and black are those for which events are being ranked. b, Cryptic activation events are evidenced by split-reads spanning: (i) an annotated acceptor and an unannotated donor or (ii) an annotated donor and an unannotated acceptor. c, Example showing the Top-4* events for NM_130786 (A1BG) exon 2 donor (g.58353291). Exon/intron lengths are not drawn to scale. Arc thickness corresponds to event rank. d, One hundred percent (119/119) of exon-skipping and cryptic activation events detected across 88 variants are present in 300K-RNA, and 92% are in the Top-4* events for their respective splice site. e, Percent of the 119 true-positive events detected within random subsets of the 335,663 source specimens in 300K-RNA. Gray dots show proportion across 20 random samples; blue line shows mean proportions with LOESS smoothing. f, Top-1* and Top-2* events around the splice sites affected by our 88 variants typically occur in mutually exclusive specimens—with both events seen, on average, in only 5% of total samples where either event was detected. Internal lines of boxplot denote the median value, and the lower and upper limits of the boxes represent 25th and 75th percentiles. Whiskers extend to the largest and smallest values at most 1.5IQR. An asterisk indicates our filter for events involving skipping one or two exons and cryptic activation within 600 nt of the annotated splice site.

