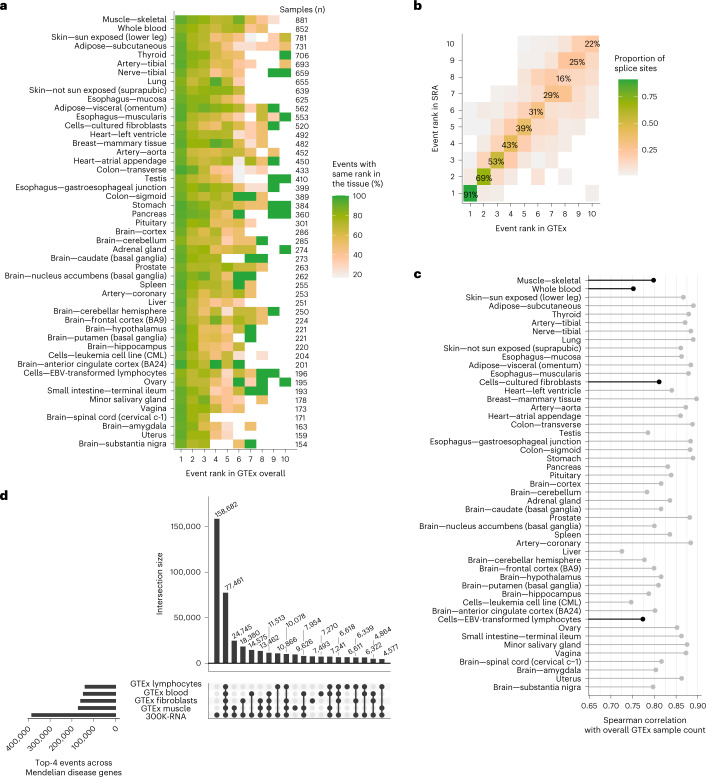
Fig. 3. 300K-RNA event rankings across tissues and data sources.
a, Heatmap showing the proportion of mis-splicing events* with the same event rank in each GTEx tissue subtype, as compared to all GTEx tissue subtypes combined—for the 88 splice sites affected by our cohort of variants. Only tissues with ≥100 GTEx samples are shown. The Top-1* event in individual tissues is concordant with the Top-1* event in ‘all GTEx tissues’ for ≥80% of splice sites. b, Concordance of top-ranked mis-splicing events* in GTEx versus SRA. The Top-1* event in GTEx is the Top-1* event in SRA for 80/88 (91%) splice sites in our cohort. c, Spearman correlation of all mis-splicing events* across 98,810 annotated splice sites in clinically relevant Mendelian disease genes (Methods) in each GTEx tissue subtype versus GTEx overall. Only tissues with ≥100 GTEx samples are shown. Black, clinically accessible tissues. d, Upset plot26 showing 300K-RNA Top-4* across clinically relevant Mendelian disease genes (four events per splice site, n = 383,677 in total) versus Top-4* specific to four clinically accessible tissues in GTEx. Twenty percent (77,461/383,677) of all 300K-RNA Top-4* across clinically relevant Mendelian disease genes are captured as Top-4* events among all four clinically accessible tissues (blood, fibroblasts, EBV-LCL and muscle). An asterisk indicates filtering to skipping one or two exons and cryptic activation within 600 nt of the annotated splice site.

