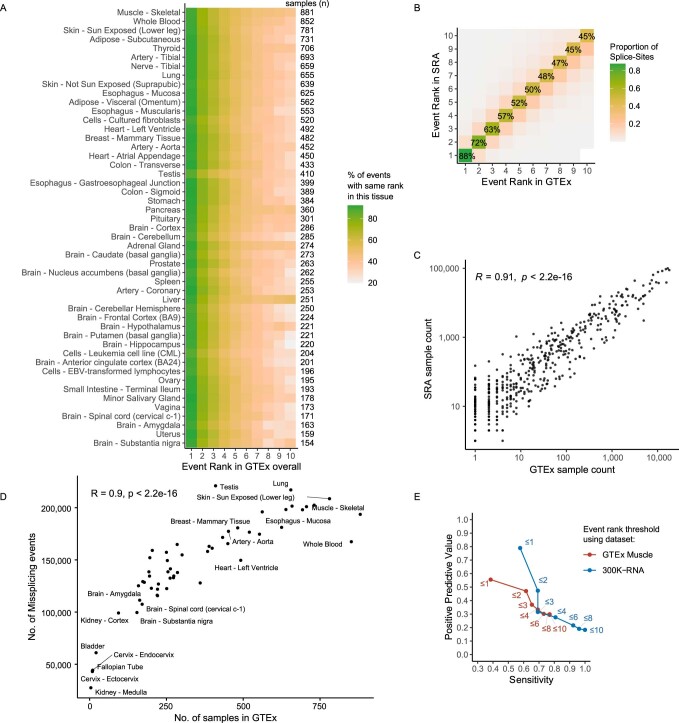
Extended Data Fig. 3. 300K-RNA event rankings across tissues and data-sources.
a) Heatmap showing the proportion of mis-splicing events* with the same event rank in each GTEx tissue subtype, as compared to all GTEx tissue subtypes combined, for 98,810 annotated splice-sites in clinically relevant Mendelian disease genes (see methods). The top-1* event is > 86% concordant across all tissues with > 100 samples in GTEx. b) Concordance of top-ranked mis-splicing events* in GTEx versus SRA. The top-1* event in GTEx is the top-1* event in SRA for 88% all splice-sites in clinically relevant Mendelian disease genes. c) Sample counts are highly correlated between GTEx and SRA for all unannotated splicing events* in 300K-RNA at the splice-sites affected by our cohort of 88 variants (Spearman correlation, R = 0.91, p < 2.2e−16). d) Sequencing breadth in GTEx samples increases sensitivity that is the more specimens the greater the proportion of total mis-splicing events detected, with testis being a notable outlier (Spearman correlation, R = 0.91, p < 2.2e−16). e) Sensitivity and PPV of Top-ranked* events seen in either 300K-RNA (blue) or GTEx Muscle (red, 881 samples in GTEx), for 19 variants associated with muscle disorders and where RNA testing was performed using muscle RNA. * = skipping one or two exons and cryptic activation within 600 nt of the annotated splice-site.

