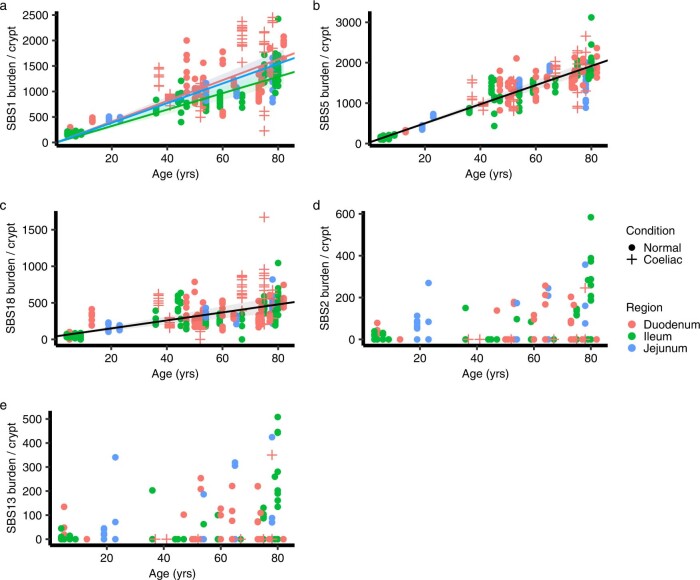
Extended Data Fig. 5. Signature burden versus age for SBS1, SBS5, SBS18, SBS2 and SBS13.
Regression lines were estimated using linear mixed models. Error bands represent 95% confidence interval for the fixed effect of age. Colors indicate biopsy regions, with orange, green and blue representing duodenum, ileum and jejunum, respectively. Shapes indicate whether the donor has a celiac history or not. Crosses indicates donors with a celiac history, and dots indicate donors without a celiac history. (a) SBS1 burden versus age, showing regression lines for the three different sectors of the small intestine. (b) SBS5 burden versus age, showing a regression line for all samples because the rate is not statistically different for the three sectors according to linear mixed models. (c) SBS18 burden versus age, showing a regression line for all samples because the rate is not statistically different for the three sectors according to linear mixed models. (d) SBS2 burden versus age, the relationship is not linear. (e) SBS13 burden versus age, the relationship is not linear.

