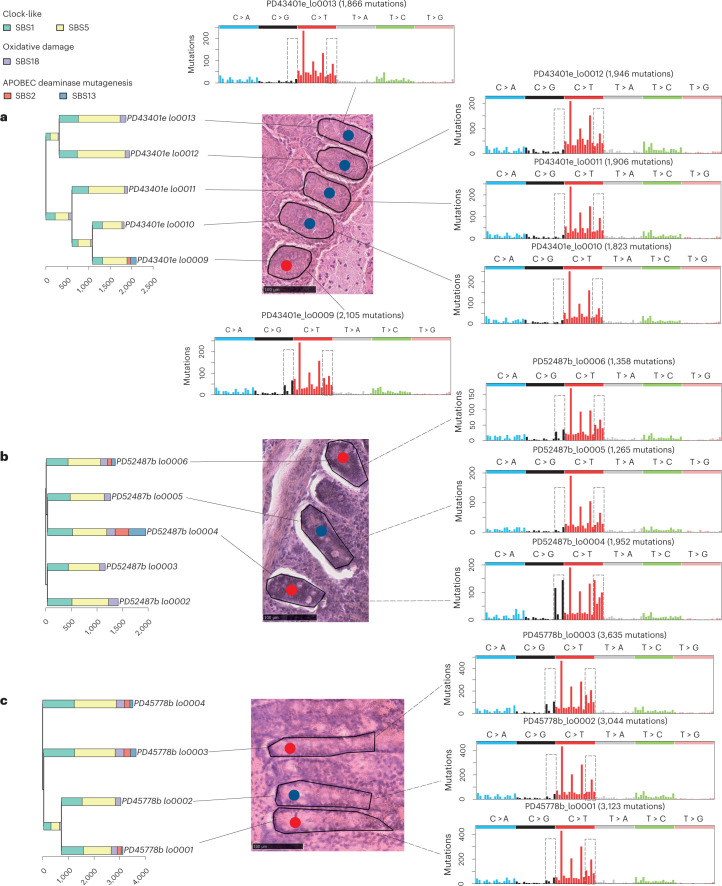
Fig. 3. Spatial distribution of APOBEC-positive crypts.
APOBEC-positive crypts and their surrounding crypts before microdissection with their SBS mutational spectrums. Signatures exposures are color coded on top left. Red dots, APOBEC-positive crypts. Blue dots, APOBEC-negative crypts that have been sequenced. Gray rectangles on the mutational spectra circle characteristic peaks of SBS2/SBS13. a, PD43401, this individual has one APOBEC-positive crypt but all the remaining crypts in the neighborhood are negative. b, PD52487, with an APOBEC-negative crypt (PD52487b_lo0005) between APOBEC-positive crypts. c, PD45778, an APOBEC-negative crypt (PD45778b_lo0002) between APOBEC-positive crypts.

