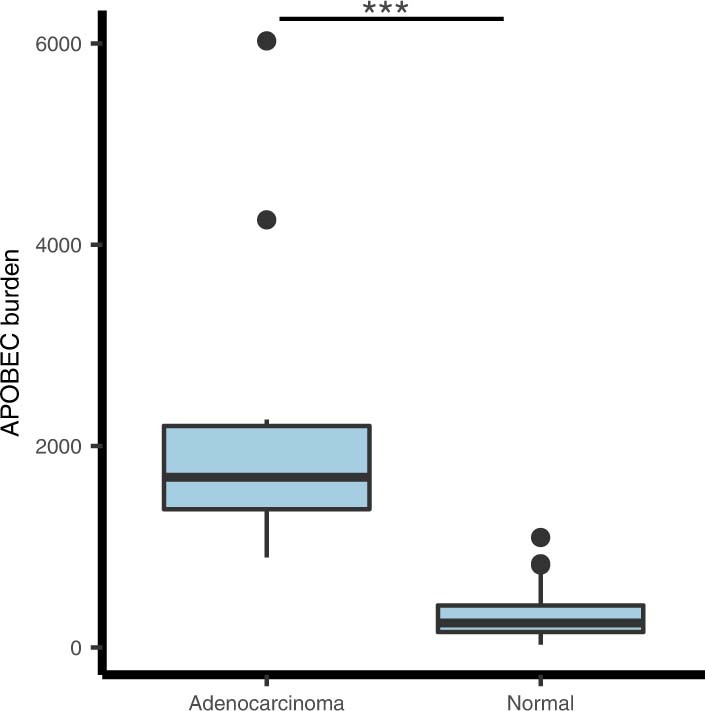
Extended Data Fig. 4. Comparison of APOBEC mutagenesis in small bowel cancer and normal crypts.

Boxplot of SBS2/13 exposures in small bowel adenocarcinomas and normal crypts with APOBEC mutagenesis (n = 14 for adenocarcinomas and n = 58 for normal crypts). The central line, box and whiskers represent the median, interquartile range (IQR) from first to third quartiles, and 1.5 × IQR, respectively. Burdens in cancer WES data have been adjusted by the proportion of exomes in genome to compare with whole-genome sequencing data. Median = 1691 (adenocarcinoma) and 242 (normal), two-tailed t-test P = 2 × 10⁻⁴.
