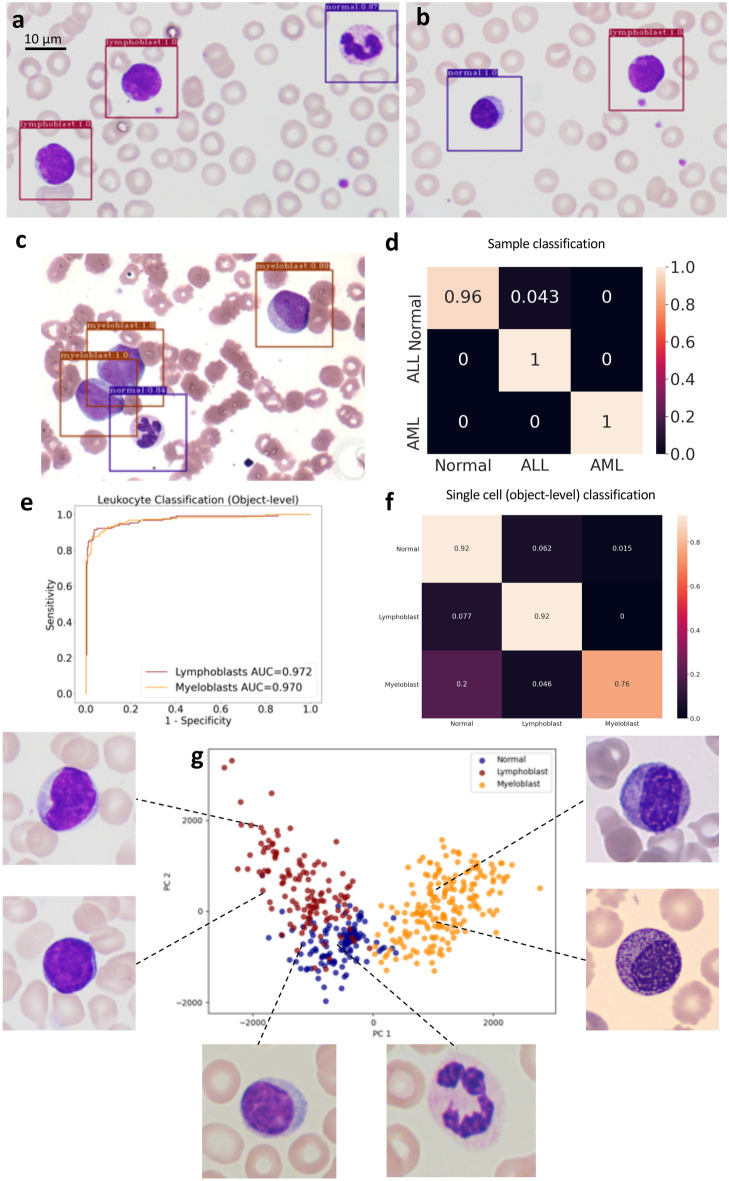
Figure 2.
Acute leukemia detection and typing in blood films. (a, b) Normal WBC and lymphoblasts detected in two ALL positive sample from the hold out validation set. (c) Normal leucocytes and myeloblasts detected by MILLIE in an AML sample. (d) Confusion matrix for sample classification on the validation set. (e) Receiver operating characteristic (ROC) curve for single cell classification on the cell image test set. (f) Confusion matrix for cell classification (lymphoblasts vs myeloblasts vs normal) on the cell image test set. (g) PCA visualization of the convolutional representations learned by MILLIE of the individual cells in the test set.

