
Fig. 1.
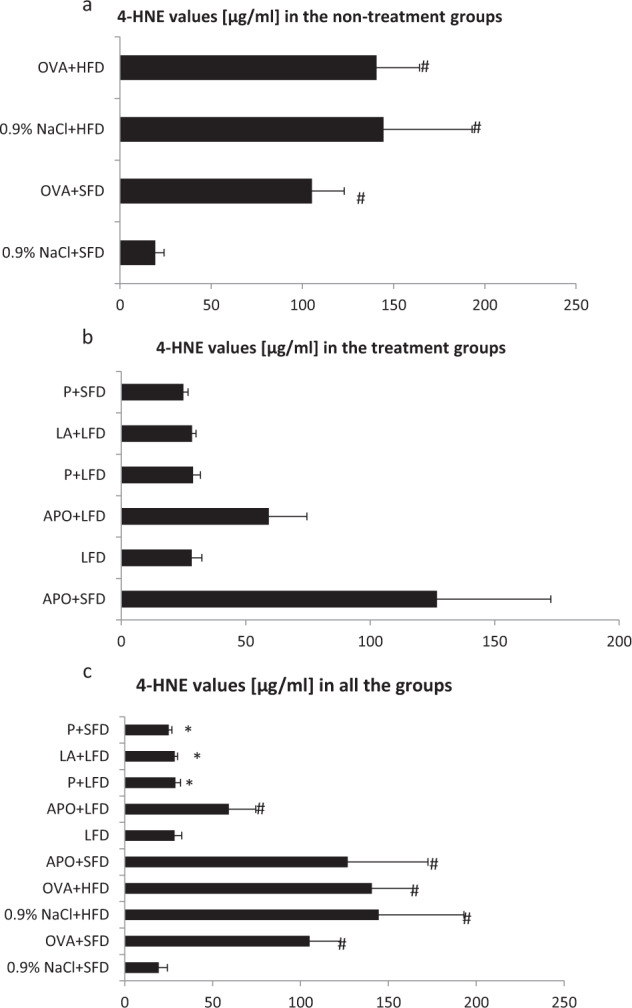
4-HNE levels in all the groups of animals. Data are shown as mean ± SD. a 4-HNE values [µg/ml] in the non-treatment groups (respectively: standard-fat diet group—control, standard-fat diet group with ovalbumin, high-fat diet group and high-fat diet group with ovalbumin); b 4-HNE values in the treatment groups (respectively: administration of apocynin—15 mg/kg with standard-fat diet; supplementation of low-fat diet alone; administration of apocynin—15 mg/kg with low-fat diet; supplementation of probiotic with low-fat diet; administration of lipoic acid—100 mg/kg with low-fat diet; supplementation of probiotic with standard-fat diet); c 4-HNE values [µg/ml] in all the groups of animals; #p < 0.05 vs. the 0.9% NaCl + SFD group; *p < 0.05 vs. the OVA + HFD group (Dunn’s method)