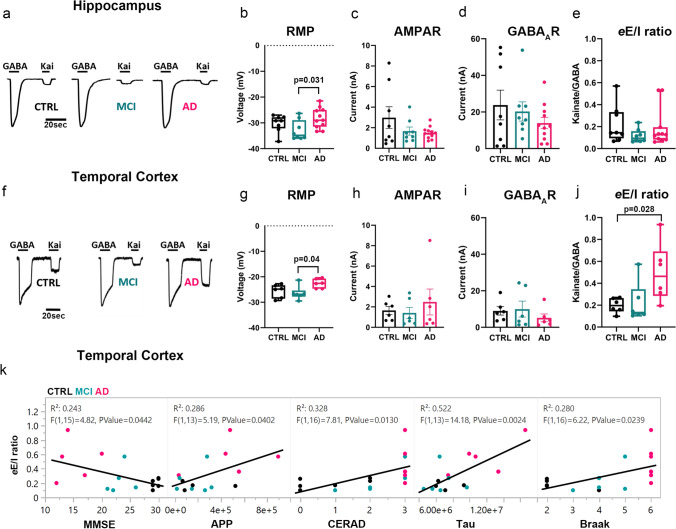
Fig. 1.
Differential perturbation of the eE/I balance in the hippocampus and TCx of AD donors. a, f, Representative electrophysiological responses from oocytes microtransplanted with human synaptic membranes from the hippocampus or TCx and perfused with 1 mM GABA or 100 µM kainate (Kai), an agonist of AMPARs. b, g, The resting membrane potential (RMP) of oocytes microtransplanted with human membranes was different across diagnostic groups in hippocampus (F (2, 24) = 3.71, p = 0.039) and TCx (F (2, 15) = 4.08, p = 0.038) and was more depolarized in AD compared to MCI (hippocampus post hoc Tukey p = 0.031; TCx post hoc Tukey p = 0.039). c, h, AMPAR responses to Kai were not significantly different across diagnostic groups in either the hippocampus (F (2, 24) = 1.78, p = 0.19) or the TCx (F (2, 15) = 0.46, p = 0.64). Each point is the average of the maximum response to Kai per donor. d, i, GABAAR responses to GABA did not show differences within diagnostic groups (hippocampus; F (2, 24) = 0.91, p = 0.42; TCx; F (2, 15) = 0.66, p = 0.53). e, j, Electrophysiological E/I balance (eE/I) was increased in the TCx (F (2, 15) = 4.58, p = 0.028 followed by Dunnett’s test p = 0.028 and Tukey’s test p = 0.039) but not in the hippocampus (F (2, 24) = 1.09, p = 0.35). The eE/I balance was calculated from the near-simultaneous recording of maximum responses of AMPARs and GABAARs in every single oocyte. Each point is the average of at least 3 oocytes per donor from 6 (hippocampus) or 5 (TCx) independent experiments (details in Supplementary dataset 4, online resource). In panels c, d, h, and i, bars are presented with standard error; in b, g, e and j, the box plots extend from the 25th to 75th percentiles, and the whiskers extend down to the minimum and up to the maximum value. One-way ANOVA was used in all tests. k, Pro-excitatory shift of the eE/I ratio in TCx is correlated with loss of cognitive performance, increase of APP abundance and CERAD, as well as with tau levels and Braak stage. Each dot represents the average value for each donor color coded as shown in a

