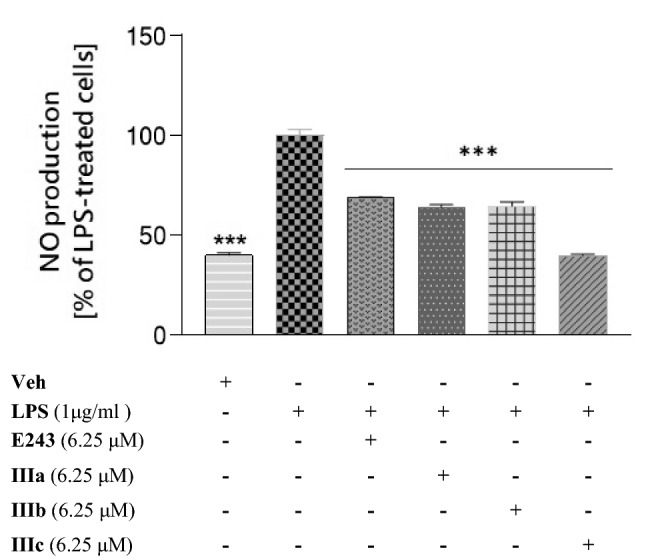
Fig. 6.

The effect of the compounds tested (E243 and IIIa–IIIc) on nitric oxide (NO) production in BV-2 cells assessed by the Griess assay. BV-2 cells were pretreated for 1 h with indicated compounds at the concentration of 6.25 μM, followed by stimulation with 1 μg/ml LPS for 24 h. Data are expressed as mean ± SEM of two independent experiments, each of which consisted of eight replicates per treatment group and is expressed as a percentage of NO production versus cells treated with LPS (set at 100%). Statistical analysis by one-way ANOVA showed significant differences between the groups (α 0.05) and was followed by the Dunnett’s multiple comparison test. Data indicated with ***p 0.001 (versus vehicle-treated cells) reflect statistically significant differences between the control and experimental groups
