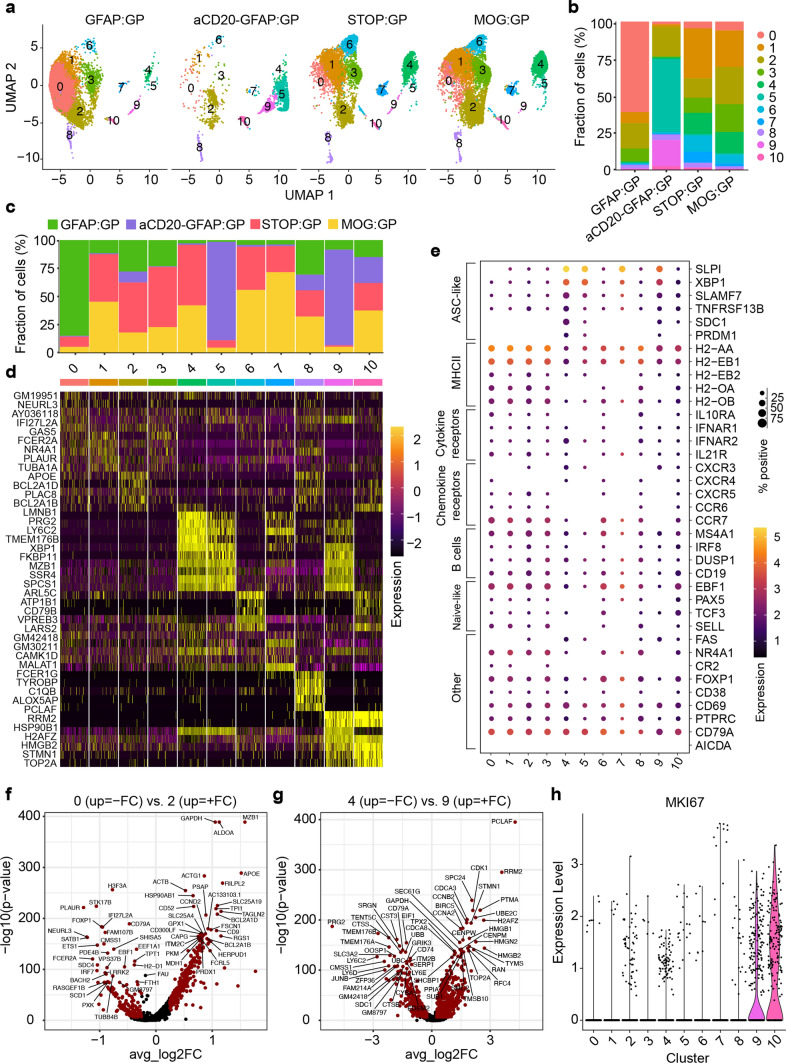
Fig. 2.
Single-cell immune repertoire sequencing reveals heterogeneous populations of CNS B cells following infection and autoimmunity. a Uniform manifold approximate projection (UMAP) split by sample and colored by transcriptional cluster. b The fraction of cells in each transcriptional cluster separated by experimental group. c Distribution of experimental groups per transcriptional cluster. d Differentially expressed genes defining each cluster. e Gene expression levels of B cell markers separated by cluster membership (x-axis). The size of the dot corresponds to the percentage of cells expressing the given marker and the color indicates the mean expression per cell within each cluster. f Differentially expressed genes between clusters 0 and 2. Points in red indicate differentially expressed genes (adjusted P value < 0.01 and average log2 fold change (FC) > 0.25). 204 differentially expressed genes were upregulated in cluster 0 and 573 and in cluster 2. g Differentially expressed genes between clusters 4 and 9. 862 differentially expressed genes were upregulated in cluster 4 and 573 in cluster 9. h Normalized expression of Mki67 separated by transcriptional cluster

