Fig. 3.
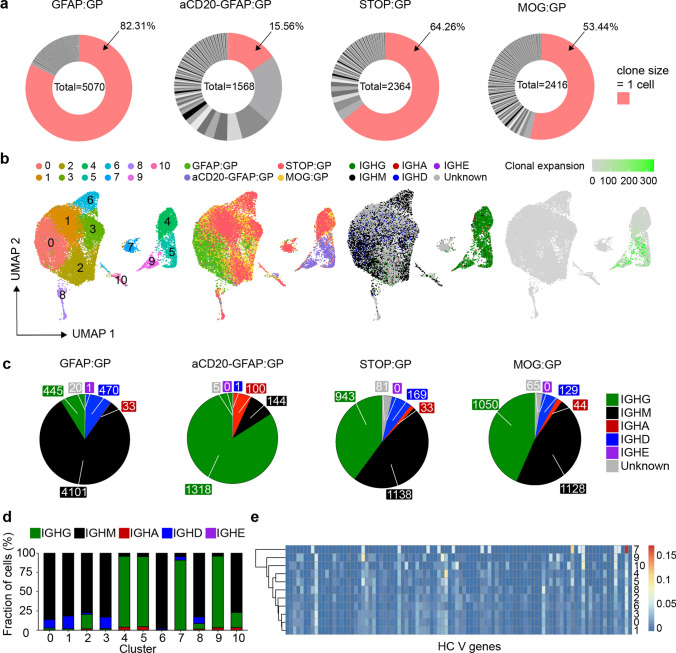
Profiling the clonally expanded, class-switched antibody-secreting cells (ASCs) populating the brain following intracranial infection. a Distribution of clonal expansion for each experimental group. Each section corresponds to a unique clone and the size corresponds to the fraction of cells relative to the total repertoire. Red color highlights the fraction of clones containing 1 cell. The number in the center of the circle refers to the total number of recovered B cells. b Uniform manifold approximation projection (UMAP) depicting transcriptional cluster, group identity, antibody isotype, and clonal expansion for all recovered single-cells. Clonal expansion refers to the number of cells assigned to a single clone based on default clonotyping using Enclone. c Distribution of antibody isotype for all cells within each experimental group. d Distribution of antibody isotype for all cells within each transcriptional cluster. Cells with no isotype assigned (unknown) were removed. e Heavy chain clonal V gene usage across transcriptional clusters

